Supplemental Material
advertisement

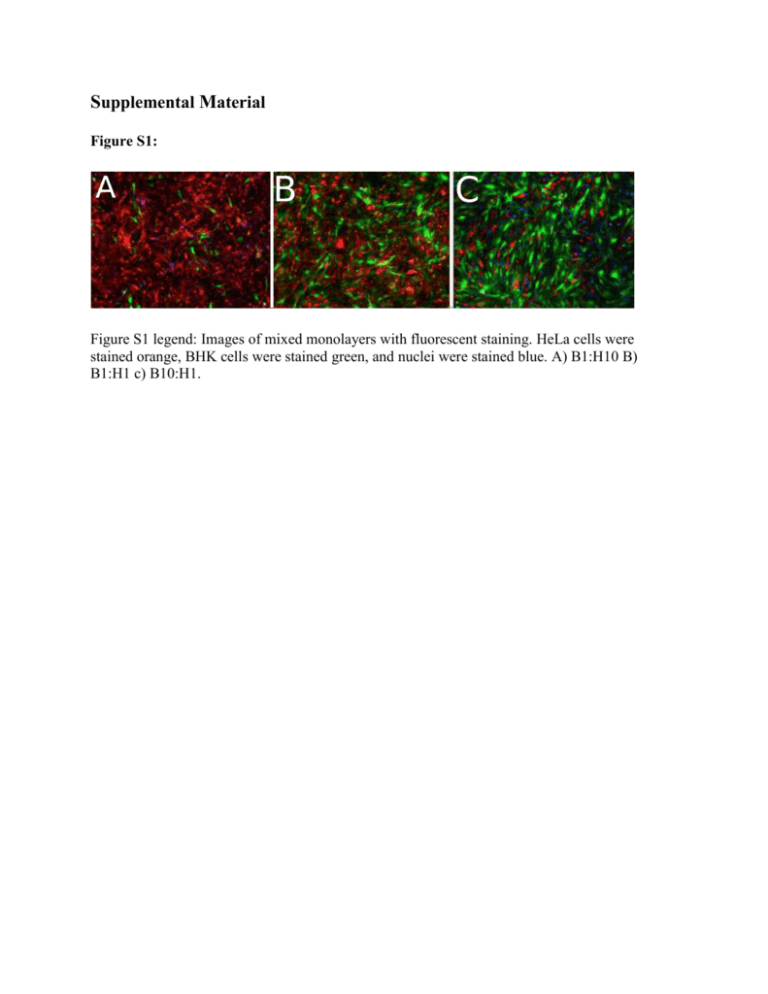
Supplemental Material Figure S1: Figure S1 legend: Images of mixed monolayers with fluorescent staining. HeLa cells were stained orange, BHK cells were stained green, and nuclei were stained blue. A) B1:H10 B) B1:H1 c) B10:H1. Figure S2: 0.2 0.3 0.1 0.2 0.3 40 0 0.0 0.4 20 Frequency 40 20 0 0.0 0.4 0.1 0.2 0.3 0.0 0.4 0.1 0.2 0.3 0.4 Percent of population Percent of population Frequency distribution of minority variants B1:H0_A_1 Frequency distribution of minority variants B1:H0_A_2 Frequency distribution of minority variants B1:H10_A_1 Frequency distribution of minority variants B1:H10_A_2 0.3 0.0 0.4 0.1 0.2 0.3 0 0.0 0.4 20 Frequency 40 0 0 0.2 20 Frequency 40 20 Frequency 40 20 0.1 40 Percent of population 0 0.1 0.2 0.3 0.0 0.4 0.1 0.2 0.3 0.4 Percent of population Percent of population Percent of population Frequency distribution of minority variants B5:H1_C_1 Frequency distribution of minority variants B5:H1_C_2 Frequency distribution of minority variants B1:H10_C_1 Frequency distribution of minority variants B1:H10_C_2 0.2 0.3 Percent of population 0.4 0.0 0.1 0.2 0.3 Percent of population 0.4 0 20 Frequency 40 0 0 0.1 20 Frequency 40 Frequency 40 20 0 0.0 40 Percent of population 20 Frequency Frequency 40 0 0.1 Percent of population 0.0 Frequency 20 Frequency 40 20 0 Frequency 0.0 Frequency distribution of minority variants B1:H1_C_2 Frequency distribution of minority variants B1:H1_C_1 Frequency distribution of minority variants Ancestor_2 Frequency distribution of minority variants Ancestor_1 0.0 0.1 0.2 0.3 Percent of population 0.4 0.0 0.1 0.2 0.3 0.4 Percent of population Figure S2 legend: Distributions of minority allele frequencies in VSV populations. Alleles are included in this analysis if they are >1% frequency and occur at a site with coverage >30. The distributions above are a representative sample of the populations sequenced. These distributions show that most minority alleles exist at low frequencies (>5%). Each population was sequenced in duplicate, and the two technical replicates are shown side by side (e.g. Ancestor_1 and Ancestor_2). Appendix 1: 2661398 3218552 1448444 2811326 2412636 2041640 1464686 1836618 1822050 2921200 1029110 1905532 2365244 1049068 2811898 1789820 2355832 1185472 1804304 3221144 761840 1069158 1159400 2122722 1434992 2653084 1844706 1462548 2060884 2316164 1762744 2209128 1811072 1558068 1527012 2445994 2430000 1448534 1610804 870972 3119120 3431160 2423638 698446 2637826 3204428 1433914 2785988 2387198 2022292 1450612 1821066 1806728 2893096 999442 1886558 2345244 1022342 2784466 1761154 2332542 1173518 1781766 3194110 744256 1053136 98.8% 99.1% 98.8% 99.1% 98.7% 99.2% 98.9% 98.9% 98.9% 98.9% 98.8% 98.5% 98.2% 99.0% 99.0% 98.6% 98.2% 98.2% 99.2% 99.2% 99.0% 98.9% 99.1% 99.6% 99.0% 99.1% 98.9% 99.1% 99.0% 99.2% 99.2% 99.0% 97.1% 99.0% 99.2% 97.5% 99.0% 98.4% 99.0% 99.0% 98.8% 99.2% 97.7% 98.5% 5448 6582 5930 6723 6233 5855 6565 6524 6282 6655 6449 6574 6627 6816 6639 6031 6838 4633 6745 6775 7132 4048 7240 6786 5994 6651 6445 6602 6494 7118 6969 7452 4991 6533 6665 5044 7447 6949 6637 5856 6987 6720 4377 5238 Population Replicate 1 Replicate 2 Total Reads Rep 1 Total Reads Rep 2 Mapped reads Rep 1 Mapped reads Rep 2 Mapping percentage Rep1 Mapping percentage Rep2 Av Cov. Rep 1 Av Cov. Rep 1 1173656 2142486 1452904 2677216 1868860 1474180 2083058 2342388 1781630 2233018 1832996 1582500 1555408 2469762 2455302 1469104 1639678 887296 3145078 3459856 2447880 706018 Treatment 37 16 17 18 19 38 21 22 23 24 25 39 40 28 29 30 43 44 33 41 42 36 A B C A B C A B C A B C A B C A B C A B C 15 1 2 3 4 20 5 6 7 8 9 26 27 10 11 12 31 32 13 34 35 14 ANCESTOR 100% BHK 100% BHK 100% BHK 90% BHK, 10% HeLa 90% BHK, 10% HeLa 90% BHK, 10% HeLa 80% BHK, 20% HeLa 80% BHK, 20% HeLa 80% BHK, 20% HeLa 50% BHK, 50% HeLa 50% BHK, 50% HeLa 50% BHK, 50% HeLa 20% BHK, 80% HeLa 20% BHK, 80% HeLa 20% BHK, 80% HeLa 10% BHK, 90% HeLa 10% BHK, 90% HeLa 10% BHK, 90% HeLa 100% HeLa 100% HeLa 100% HeLa Appendix 2: Treatment Population ANCESTOR 100%/BHK 100%/BHK 100%/BHK 90%/BHK,/10%/HeLa 90%/BHK,/10%/HeLa 90%/BHK,/10%/HeLa 80%/BHK,/20%/HeLa 80%/BHK,/20%/HeLa 80%/BHK,/20%/HeLa 50%/BHK,/50%/HeLa 50%/BHK,/50%/HeLa 50%/BHK,/50%/HeLa 20%/BHK,/80%/HeLa 20%/BHK,/80%/HeLa 20%/BHK,/80%/HeLa 10%/BHK,/90%/HeLa 10%/BHK,/90%/HeLa 10%/BHK,/90%/HeLa 100%/HeLa 100%/HeLa 100%/HeLa A B C A B C A B C A B C A B C A B C A B C 10% 5% 1% 4 5 2 5 4 6 9 7 7 5 5 4 5 3 10 5 5 5 11 5 8 5 9 10 9 12 8 13 17 20 13 14 15 10 13 9 20 11 15 12 23 13 16 12 112 94 80 191 301 111 181 243 102 181 135 227 214 174 210 309 277 125 235 247 239 122 Appendix 2 legend: For each sequenced population, this table lists the number of minority alleles detected at each frequency cut-off. Each population was sequenced in duplicate, and only alleles detected in both technical replicates were included in this analysis. Appendix 3: Appendix 3: Depth of coverage over the genome for each sample. Locations of primers and amplicons used to amplify genome fragments shown by arrows and dotted lines above reference genome. Coverage figures generated using BEDTools v2.25.0 (1) and Integrative Genomics Viewer (IGV) v2.3.61 (2, 3). Continued on next page. 1. 2. 3. Quinlan, Aaron R., Ira M. Hall. BEDTools: a flexible suite of utilities for comparing genomic features. Bioinformatics 26 (6). 841-842 (2010). James T. Robinson, Helga Thorvaldsdóttir, Wendy Winckler, Mitchell Guttman, Eric S. Lander, Gad Getz, Jill P. Mesirov. Integrative Genomics Viewer. Nature Biotechnology 29, 24–26 (2011). Helga Thorvaldsdóttir, James T. Robinson, Jill P. Mesirov. Integrative Genomics Viewer (IGV): high-performance genomics data visualization and exploration. Briefings in Bioinformatics 14, 178-192 (2013). Appendix 3 (continued): Appendix 3: Depth of coverage over the genome for each sample. Locations of primers and amplicons used to amplify genome fragments shown by arrows and dotted lines above reference genome. Coverage figures generated using BEDTools v2.25.0 (1) and Integrative Genomics Viewer (IGV) v2.3.61 (2, 3). Continued on next page. 4. 5. 6. Quinlan, Aaron R., Ira M. Hall. BEDTools: a flexible suite of utilities for comparing genomic features. Bioinformatics 26 (6). 841-842 (2010). James T. Robinson, Helga Thorvaldsdóttir, Wendy Winckler, Mitchell Guttman, Eric S. Lander, Gad Getz, Jill P. Mesirov. Integrative Genomics Viewer. Nature Biotechnology 29, 24–26 (2011). Helga Thorvaldsdóttir, James T. Robinson, Jill P. Mesirov. Integrative Genomics Viewer (IGV): high-performance genomics data visualization and exploration. Briefings in Bioinformatics 14, 178-192 (2013). Primer Sequences Primers used to generate amplicons for VSV consensus sequencing. Forward Primer Reverse Primer CGAAGACAAACAAACCATTATTATC TGGTTCAGATTCTGTGTCAG AATTGACAGCTCTTCTGCTC CTTCTCTCTGAAATCAGA GAAAAATGTTCCTTCCAATTACCA GGGATTGGCTTGACATGATG TCAGAACATACTCAGATGTGG GTCCATGGAAATGAGGTT TCATCTTAGCTCAAAGGCTC TGGGTCTAGTAAGTCGGGTA GACTCATTCAAAATTCTCGC CAAGAGTCTAGCAAATGTCC GCTCTCAATCAAATGGTTTC AGGAATGGAGGTGATACACT GTGGGGACAAGAGATAAAAC ACGAAGACCACAAAACCAG Fitness Data for evolved VSV populations Treatment (% BHK) 100 100 100 100 100 100 100 100 100 100 100 100 100 100 100 100 100 100 91 91 91 91 91 91 91 91 91 91 91 91 91 91 91 91 91 91 83 83 83 83 83 83 83 83 83 83 83 83 83 83 83 83 83 83 50 50 50 50 50 50 50 50 50 Assayed Population log W relative to common competitor Assay Host B1:H0 A 0.47778577 BHK B1:H0 A 0.415515444 BHK B1:H0 A 1.10219011 BHK B1:H0 A 2.778819272 HeLa B1:H0 A 0.621309357 HeLa B1:H0 A 0.916290732 HeLa B1:H0 B 1.360318875 BHK B1:H0 B 1.570638163 BHK B1:H0 B -0.449916871 BHK B1:H0 B 1.422012444 HeLa B1:H0 B 1.094497555 HeLa B1:H0 B 2.233646663 HeLa B1:H0 C 1.037987667 BHK B1:H0 C -0.258583542 BHK B1:H0 C 1.811866593 BHK B1:H0 C 1.501721683 HeLa B1:H0 C 0.644957797 HeLa B1:H0 C 1.890258895 HeLa B10:H1 A 0.463572739 BHK B10:H1 A 0.550488326 BHK B10:H1 A -0.217218862 BHK B10:H1 A 0.066609941 HeLa B10:H1 A 0.344346293 HeLa B10:H1 A 0.751763824 HeLa B10:H1 B -1.04668106 BHK B10:H1 B -0.064941017 BHK B10:H1 B -0.251314428 BHK B10:H1 B 1.966980621 HeLa B10:H1 B 1.458615023 HeLa B10:H1 B 1.751174189 HeLa B10:H1 C 1.007383276 BHK B10:H1 C 2.784129019 BHK B10:H1 C 1.439791108 BHK B10:H1 C 0.346276237 HeLa B10:H1 C 1.230695874 HeLa B10:H1 C 1.097509753 HeLa B5:H1 A -1.08797389 BHK B5:H1 A -0.909370289 BHK B5:H1 A -1.225333931 BHK B5:H1 A 1.993625622 HeLa B5:H1 A -0.120627988 HeLa B5:H1 A 0.255055218 HeLa B5:H1 B 0.225609644 BHK B5:H1 B 1.17711974 BHK B5:H1 B 0.657429098 BHK B5:H1 B 0.785468509 HeLa B5:H1 B 0.486306007 HeLa B5:H1 B 0.449384342 HeLa B5:H1 C 0.523498175 BHK B5:H1 C -0.136132174 BHK B5:H1 C 0.332705754 BHK B5:H1 C 0.772093998 HeLa B5:H1 C 1.828844216 HeLa B5:H1 C 0.275653497 HeLa B1:H1 A 0.10336215 BHK B1:H1 A -0.73496247 BHK B1:H1 A 0.345127472 BHK B1:H1 A 0.754357912 HeLa B1:H1 A 1.033097682 HeLa B1:H1 A 0.236827471 HeLa B1:H1 B -1.024924573 BHK B1:H1 B 0.878864326 BHK B1:H1 B -1.067170763 BHK Treatment (% BHK) 50 50 50 50 50 50 50 50 50 17 17 17 17 17 17 17 17 17 17 17 17 17 17 17 17 17 17 9 9 9 9 9 9 9 9 9 9 9 9 9 9 9 9 9 9 0 0 0 0 0 0 0 0 0 0 0 0 0 0 0 0 0 0 Assayed Population log W relative to common competitor Assay Host B1:H1 B 0.358212223 HeLa B1:H1 B 0.830358662 HeLa B1:H1 B -0.405111188 HeLa B1:H1 C -1.149384614 BHK B1:H1 C -0.884202417 BHK B1:H1 C 0.610478076 BHK B1:H1 C 0.805065097 HeLa B1:H1 C 1.735670003 HeLa B1:H1 C 0.679416988 HeLa B1:H5 A 0.014473165 BHK B1:H5 A -0.673729095 BHK B1:H5 A -0.898999235 BHK B1:H5 A 0.865708422 HeLa B1:H5 A 0.96192083 HeLa B1:H5 A 0.470003629 HeLa B1:H5 B 0.594707108 BHK B1:H5 B 0.497872528 BHK B1:H5 B 0.776911369 BHK B1:H5 B 3.432435132 HeLa B1:H5 B 1.187843422 HeLa B1:H5 B 1.934671331 HeLa B1:H5 C -0.277319285 BHK B1:H5 C -4.239221605 BHK B1:H5 C -0.713950308 BHK B1:H5 C 1.70296397 HeLa B1:H5 C 2.261246436 HeLa B1:H5 C 0.8940017 HeLa B1:H10 A 0.630846154 BHK B1:H10 A -0.351186051 BHK B1:H10 A 1.208746083 BHK B1:H10 A 0.071188262 HeLa B1:H10 A 0.303995648 HeLa B1:H10 A 1.192426813 HeLa B1:H10 B -0.318817301 BHK B1:H10 B -0.855927002 BHK B1:H10 B -0.511549344 BHK B1:H10 B 1.61485798 HeLa B1:H10 B 1.735130857 HeLa B1:H10 B 1.196791445 HeLa B1:H10 C -0.167838706 BHK B1:H10 C -0.429418349 BHK B1:H10 C -0.853489831 BHK B1:H10 C 1.241713132 HeLa B1:H10 C 2.915310706 HeLa B1:H10 C 1.915951962 HeLa B0:H1 A 0.020000667 BHK B0:H1 A 0.746391695 BHK B0:H1 A 0.232114817 BHK B0:H1 A 1.351751064 HeLa B0:H1 A 0.391024424 HeLa B0:H1 A 1.727220948 HeLa B0:H1 B -0.215361411 BHK B0:H1 B -0.057238232 BHK B0:H1 B 0.577892591 BHK B0:H1 B 1.661139287 HeLa B0:H1 B 1.081735418 HeLa B0:H1 B 1.367062999 HeLa B0:H1 C 1.196649403 BHK B0:H1 C 0.760625218 BHK B0:H1 C 1.200591975 BHK B0:H1 C 0.853822403 HeLa B0:H1 C 0.864597808 HeLa B0:H1 C 0.971017534 HeLa


