Graduate Program in Public Health
advertisement
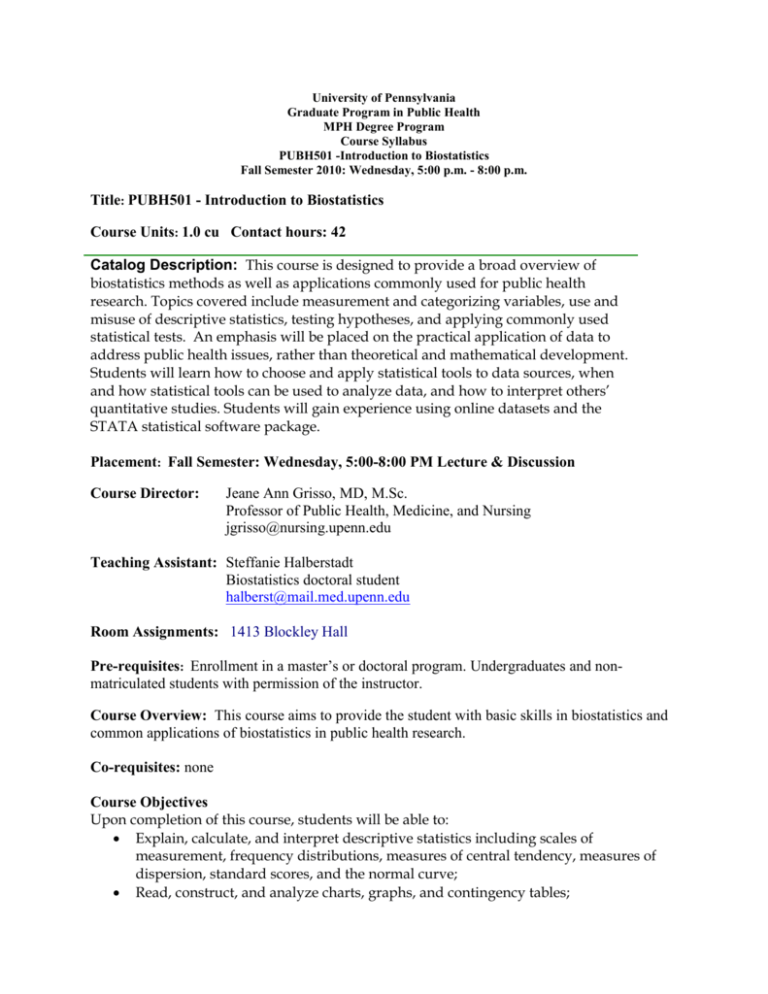
University of Pennsylvania Graduate Program in Public Health MPH Degree Program Course Syllabus PUBH501 -Introduction to Biostatistics Fall Semester 2010: Wednesday, 5:00 p.m. - 8:00 p.m. Title: PUBH501 - Introduction to Biostatistics Course Units: 1.0 cu Contact hours: 42 Catalog Description: This course is designed to provide a broad overview of biostatistics methods as well as applications commonly used for public health research. Topics covered include measurement and categorizing variables, use and misuse of descriptive statistics, testing hypotheses, and applying commonly used statistical tests. An emphasis will be placed on the practical application of data to address public health issues, rather than theoretical and mathematical development. Students will learn how to choose and apply statistical tools to data sources, when and how statistical tools can be used to analyze data, and how to interpret others’ quantitative studies. Students will gain experience using online datasets and the STATA statistical software package. Placement: Fall Semester: Wednesday, 5:00-8:00 PM Lecture & Discussion Course Director: Jeane Ann Grisso, MD, M.Sc. Professor of Public Health, Medicine, and Nursing jgrisso@nursing.upenn.edu Teaching Assistant: Steffanie Halberstadt Biostatistics doctoral student halberst@mail.med.upenn.edu Room Assignments: 1413 Blockley Hall Pre-requisites: Enrollment in a master’s or doctoral program. Undergraduates and nonmatriculated students with permission of the instructor. Course Overview: This course aims to provide the student with basic skills in biostatistics and common applications of biostatistics in public health research. Co-requisites: none Course Objectives Upon completion of this course, students will be able to: Explain, calculate, and interpret descriptive statistics including scales of measurement, frequency distributions, measures of central tendency, measures of dispersion, standard scores, and the normal curve; Read, construct, and analyze charts, graphs, and contingency tables; Understand the basic concepts of inferential statistics including probability, confidence intervals, and hypothesis testing; Know when and how to apply common parametric statistical tests; Develop basic skills in critical review of the public health literature; Gain experience using computer technology in the application of statistical procedures Develop a proposed research project including a plan for biostatistical analysis Core Competencies: 1. Selects and defines variables relevant to defining public health problems 2. Recognizes how data illuminate ethical, political, scientific, economic and overall public health issues 3. Collects, summarizes, interprets and communicates information relevant to a population health issue Teaching Methods: lecture and discussion groups Evaluation Methods: MIDTERM AND FINAL EXAM- 25% each, total 50% There will be a midterm exam in class on October 20th. The final will be a “take home” exam and will be given out around December Dec. 15th. The two exams will count a total of 50% of the grade. GROUP PROJECT AND TEACHING PRESENTATIONS – 30% Each group will organize teaching presentations on one or two different statistical tests. Each group will also develop a proposal for a group project and present their proposed project to the class at the end of the semester. CLASS PARTICIPATION- 20% Class attendance, participation, and homework will count for the remaining 20% of the grade. Class Participation: Students are expected to come to class on time prepared with comments and questions from their assigned readings and exercises. They are also expected to participate actively in discussions and work in their groups to organizing a teaching session and develop a proposed project. Assigned Readings: Statistics: A tool for social research, Joseph F. Healey, Eighth edition This text will be supplemented with hand outs. Month Sept. Wed. Day. Class Topics 15 Intro to class and biostatistics Descriptive statistics Rates Ratios Percentages Graphs & Charts Assignments Healey (Chapters 1 & 2) Sept. Wed. 22 Healey (Chapters 3&4) Sept Wed. 20 Oct. Wed. Oct. 6 Measures of Central Tendency Mean Median Mode Skew Measures of Dispersion Range Standard deviation Variance The Normal Curve The concept Z-statistic Probabilities & areas under the curve Inferential Statistics Random sample Standard error of the mean Stratified sample Cluster sample NO CLASS- DR. GRISSO AWAY Healey (Chapters 5&6) 13 Oct. 20 Oct 27 Confidence Level Alpha error Bias Hypothesis Testing Null Hypothesis:Alternative Hypothesis Statistical significance One-tailed, two-tailed Sample Size: Type 1 error, Type 2 error, Power Healey (Chapters 7&8) Hypothesis testing : Student’s t-test Healey (Chapter 9) Hand out MIDTERM Nov. 3 Analysis of Variance Healey (Chapter 10) Chi Square Test Healey (Chapter 11) Nov Nov 10 17 Linear Regression Healey Chapter 15) Multivariate Regression Healey (Chapters 16, 17) Odds Ratios Hand out Logistic Regression Nov 24 Survival Analysis Hand out 1 8 Critical review of the literature NO CLASS- THANKSGIVING Presentations Hand out Dec Dec Dec 15 Presentations & Take Home Final Exam
