Exploring Quadratic Graphs Name: Finding Key Features Block: Part
advertisement
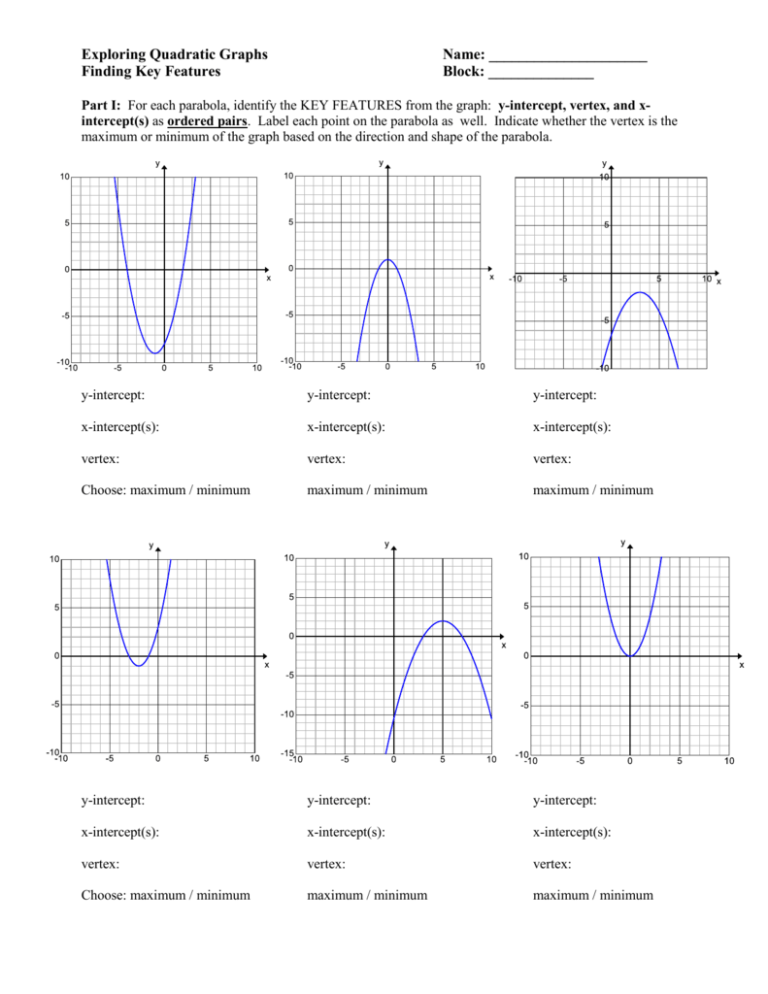
Exploring Quadratic Graphs Finding Key Features Name: _____________________ Block: ______________ Part I: For each parabola, identify the KEY FEATURES from the graph: y-intercept, vertex, and xintercept(s) as ordered pairs. Label each point on the parabola as well. Indicate whether the vertex is the maximum or minimum of the graph based on the direction and shape of the parabola. y-intercept: y-intercept: y-intercept: x-intercept(s): x-intercept(s): x-intercept(s): vertex: vertex: vertex: Choose: maximum / minimum maximum / minimum maximum / minimum y-intercept: y-intercept: y-intercept: x-intercept(s): x-intercept(s): x-intercept(s): vertex: vertex: vertex: Choose: maximum / minimum maximum / minimum maximum / minimum CALCULATOR COMMANDS 1. Finding X-intercepts: a. Hit “y=” and enter your equation b. From the TABLE: Hit “2ND- graph” x-intercepts happen when ____________ so look for these in your table. c. From the GRAPH: adjust your window so you can see the parabola cross the _________________. These are the intercepts! d. Hit “2ND- TRACE - #2 ZERO” i. The calculator asks if you are on the left side of the intercept-if you are click “enter” and if not, move left/right so the blinker is, then click “enter” ii. Repeat this process to locate “right’ of the intercept iii. The calculator will ask “GUESS? – press ENTER. iv. The intercept will appear at the bottom of your screen as “x=” v. Repeat to find the other x-intercept 2. Finding the Vertex: a. Graph your equation. b. Hit “2ND-trace” then “3” to find a minimum and “4” to find a maximum i. If your graph opens up (“U” shaped), the vertex is the ________________. ii. If your graph opens down (hill shaped”), the vertex is the ______________. c. Move the cursor to the left side of the vertex (left and right arrows) then press enter. d. Move the cursor to the right side of the vertex (left and right arrows) then press enter. e. The calculator will ask “GUESS?” – press ENTER f. The vertex coordinates will appear at the bottom of the screen X = ___ Y = ___ Part II: Graph each quadratic equation (using your calculator). Identify the key features: y-intercept, vertex, and x-intercept(s) as ordered pairs. Sketch the parabola on the grid with these features. 𝑦 = 𝑥 2 + 2𝑥 + 1 𝑦 = 2𝑥 2 + 2𝑥 − 4 𝑦 = −𝑥 2 + 5𝑥 − 6 y-intercept: x-intercept(s): vertex: Choose: maximum / minimum y-intercept: x-intercept(s): vertex: maximum / minimum y-intercept: x-intercept(s): vertex: maximum / minimum 1 𝑦 = −𝑥 2 + 6𝑥 − 9 𝑦 = −4𝑥 2 + 4 𝑦 = 2 𝑥 2 + 2𝑥 + 1 y-intercept: x-intercept(s): vertex: Choose: maximum / minimum y-intercept: x-intercept(s): vertex: maximum / minimum y-intercept: x-intercept(s): vertex: maximum / minimum Observations / Patterns: List some things you noticed about the shape of the graph, key features of the parabola, and the quadratic equation. Do you see any connections between them? Could you predict any features using just the equation? Part III: QUADRATIC REGRESSION: CALCULATOR COMMANDS 3. Modeling Quadratic Equations – “Regression:” finding quadratic equations from data sets! a. STAT- EDIT Enter the x values into L1 and y values into L2 b. Hit “STAT” go right to “Calc” and hit “#5 quadratic regression” and “enter” c. Type this equation into y=, you should see this curve graphed along with your points. 𝑦 = 𝑎𝑥 2 + 𝑏𝑥 + 𝑐, you are given the coefficients! d. If you cannot see the points, turn STAT PLOTS ON 2nd – Y=, then click ON. Practice: For each set of data, find the quadratic model (equation) for the data. Do not round any decimals. Then identify the y-intercept, x-intercept(s), and vertex point as ordered pairs. Determine whether the vertex is a maximum or minimum. Quadratic Equation: ___________________ y-intercept: x-intercept(s): vertex: Choose: maximum / minimum Quadratic Equation: _________________ y-intercept: x-intercept(s): vertex: Choose: maximum / minimum
