The Market System and Circular Flow
advertisement
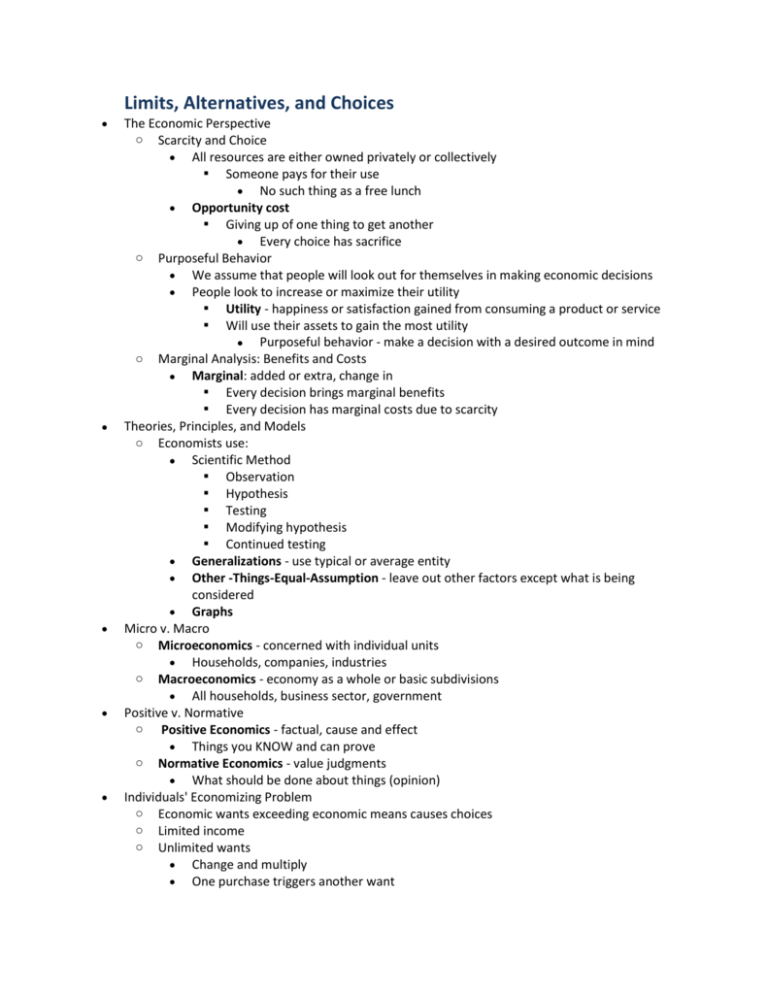
Limits, Alternatives, and Choices The Economic Perspective o Scarcity and Choice All resources are either owned privately or collectively Someone pays for their use No such thing as a free lunch Opportunity cost Giving up of one thing to get another Every choice has sacrifice o Purposeful Behavior We assume that people will look out for themselves in making economic decisions People look to increase or maximize their utility Utility - happiness or satisfaction gained from consuming a product or service Will use their assets to gain the most utility Purposeful behavior - make a decision with a desired outcome in mind o Marginal Analysis: Benefits and Costs Marginal: added or extra, change in Every decision brings marginal benefits Every decision has marginal costs due to scarcity Theories, Principles, and Models o Economists use: Scientific Method Observation Hypothesis Testing Modifying hypothesis Continued testing Generalizations - use typical or average entity Other -Things-Equal-Assumption - leave out other factors except what is being considered Graphs Micro v. Macro o Microeconomics - concerned with individual units Households, companies, industries o Macroeconomics - economy as a whole or basic subdivisions All households, business sector, government Positive v. Normative o Positive Economics - factual, cause and effect Things you KNOW and can prove o Normative Economics - value judgments What should be done about things (opinion) Individuals' Economizing Problem o Economic wants exceeding economic means causes choices o Limited income o Unlimited wants Change and multiply One purchase triggers another want Want "better" things - replacement NEED TO MAKE CHOICES THAT MAXIMIZE UTILITY o Budget Line Curve or schedule showing combinations of two products that can be purchased with a set amount of money Shows attainable/unattainable combinations Shows trade-offs and opportunity costs Straight line - constant opportunity cost Choices are made based on an analysis of marginal cost and marginal benefit The line will move if income changes Society's Economizing Problem o Scarce Resources Land - all natural resources Labor - the physical and mental abilities of people Capital - manufactured aides used in production Entrepreneurial Ability Combines other resources Makes strategic business decisions Is an innovator Bears risk involved with venture Production Possibilities Model o Assumptions Full Employment - using all available resources Fixed Resources - all inputs of production are constant Fixed Technology - current technology is all that can be used Two Goods Consumer Goods - directly address consumers' needs/wants Capital Goods - help to make consumer goods o Production Possibilities Table Lists combinations of two goods that could be produced if assumptions are followed More consumer goods - stuff now More capital goods - stuff later o Production Possibilities Curve Curve is limit of production Beyond curve is not attainable Inside the curve is attainable, but we could have more Law of Increasing Opportunity Cost As production of a particular good increases, the opportunity cost of producing an additional unit rises Bowed curve Why Resources are not adaptable Optimal Allocation Where SOCIETY sees the marginal benefit equaling the marginal cost As economists - we don't state where optimal is Unemployment, Growth, and the Future o Unemployment Not using all possible resources o o Making less than possible At a point inside the curve (Point D on graph to the right) Economic Growth Shifting the curve outward, upward, to the right How? Increasing the quantity of resources available Increasing the quality of existing resources Advances in technology International Trade Can also lead to an increase in Production Possibilities Specializing in one good and trading for the other. Specialization and Comparative Advantage Specialization and Comparative Advantage o Increases the productivity of the resources in a society More output More income o Comparative Advantage One society can produce a product at a lower opportunity cost than another Makes trade profitable when this happens o Terms of Trade The trade agreement must be better than the trade-off within a society if they produce domestically Between the opportunity costs of the to societies o Gains from Specialization and Trade Improves resource allocation Same inputs get more output Allows societies to overcome the restraints of the production possibilities curve The Market System and Circular Flow Economic Systems o Definition - set of institutional arrangements and a coordinating mechanism to respond to the economizing problem o Differences Who owns the factors of production How the system runs o Command System The government owns most resources and decides how the system works through a central plan In actuality some private ownership is/was allowed o Market System Private ownership of resources Markets and prices determine activity Ability to make money is an incentive to innovate Pure Market - no government intervention In actuality the government is involved Characteristics Private Property Includes intellectual property Freedom of Enterprise and Choice Enterprise Businesses are free to obtain things to produce their choice of goods and services Choice Resource Owners - free to sell or use their resources Workers - enter any area of interest Consumers - buy whatever they like Self-Interest Each economic unit pursues its own goals Competition Multiple buyers and seller acting independently Entities can enter or exit markets Diffuses power Economy can adjust Markets and Prices Organizing force of Market System Technology and Capital Goods Development is encouraged Efficiency is encouraged Specialization Plays on strengths Division of Labor Differences in ability Learn by doing Saves time Geographic Specialization Use of Money Active, but limited Government Correct "market failures" Five Fundament Questions o What will be produced? Based on profit or loss Profit More made More resources go to that entity New or expanded firms Losses Less made Less resources go to that entity Firms exit market (willingly or unwillingly) Consumer Sovereignty Consumers use "dollar voting" to determine what the market produces Firms and resource providers must respond Do they really have freedom o How will the goods and services be produced? Based on minimum cost per unit Right mix of resources Location of production centers Using techniques that are efficient Will shift if technology or price changes o Who will get the output? Based on willingness and ability to pay market price o How will the system accommodate change? Communicated through prices and profits Firms and resource providers must respond to changes in profits Direct change of what is made and where resources go o How will the system promote progress? Technological Advance Products - advancement means profit (promoted) Techniques/Capital - lowers costs (promoted) OUTCOMES Other firms must follow Creative Destruction - new technology and techniques destroy old ways of doing things or old products Capital Accumulation Dollar voting works here as well "The Invisible Hand" (Adam Smith, 1776) o Firms will promote society's interest when they pursue their own interest Efficiency Resources go to what society wants Lowest cost promotes new technology/techniques - lower consumer prices Incentives Innovation generates economic rewards Freedom Firms and workers are able to further their own self-interest Subject to penalties and rewards Demise of the Command System o Coordination Problem Couldn't possibly make millions of decisions for entities Failure in one industry led to failure in multiple industries Couldn't deal well with expansion Suppressed variety Production target was only indicator of success Caused shortages and surpluses Didn't look at profits or losses o Incentive Problem No incentive to make adjustments based on profits or losses Got paid based only on production No incentive to innovate Circular Flow Model o Basis of economic spending patterns Demand, Supply, and Market Equilibrium Markets o Bring together buyers and sellers o Multiple forms Internet Physical stores Catalogues Demand o Def - a schedule or curve that shows the various amounts of a product that consumers are willing and able to purchase at each of series of prices during a specified time period Willing is not enough, must be able to afford the good Demonstrates consumers' plans with respect to a product Time is important o Law of Demand As price falls → quantity demanded rises As price rises → quantity demanded falls Inverse relationship All other things equal Explanation Common sense Diminishing Marginal Utility A person gets less satisfaction from each additional unit consumed Price needs to be worth buying additional units Income Effect Lower prices raise the power of a consumer's money → buy more Substitution Effect At lower prices, consumers have incentive to substitute that product for higher priced goods o Demand Curve Downward sloping o Changes in Demand Tastes Favorable →demand up Unfavorable → demand down Number of Buyers More → demand up Less → demand down Income Normal Goods Income up →demand up Income down → demand down Inferior Goods Income up → demand down Income down → demand up Price of Related Goods Substitute Goods Price up → demand up Price down →demand down Complementary Price up → demand down Price down → demand up Consumer Expectations Expect price to drop → demand down Expect price to rise → demand up o Changes in Quantity Demanded Movement along the demand curve Effected by the product's price Supply o Def - a schedule or curve showing the various amounts of a product that producers are willing and able to make available for sale at each of a series of possible prices during a specified time period o Law of Supply As price falls → quantity supplied drops As price rises → quantity supplied rises Positive relationship All other things equal o Supply Curve Upward sloping o Changes in Supply Resource Prices Resource prices rise → supply falls Resource prices fall → supply rises Technology As technology improves → supply rises Prices of Other Goods If prices rise → entices more firms to produce → supply rises If prices fall → producers leave → supply falls Producer Expectations Hard to predict May withhold or increase production Withhold to sell more if prices rise Increase to prepare for increase in price Number of Sellers More sellers → supply rises Less sellers → supply falls o Changes in Quantity Supplied Movement along the supply curve Effected by product's price Market Equilibrium o Where the supply curve and the demand curve intersect gives you equilibrium Extend to "x" axis to determine equilibrium quantity Extend to "y" axis to determine equilibrium price o Rationing Function of Prices Equilibrium ensures that everyone who is willing and able to pay will get a product with no shortage or surplus o Efficient Allocation Productive Efficiency - making a product for the lowest cost Allocative Efficiency - making the proper mix of good and services for society Resources are going where society wants them to go Changes in Supply, Demand, and Equilibrium o D↑, S- = P↑, Q↑ o D↓, S- = P↓, Q↓ o D-, S↑ = P↓, Q↑ o D-, S↓ = P↑, Q↓ o D↑, S↑ = P?, Q↑ o D↑, S↓ = P↑, Q? o D↓, S↑ = P↓, Q? o D↓, S↓ = P?, Q↓ Government Set Prices o Price Ceilings Price set below equilibrium Protect Consumers Can't charge above the set price Causes shortages o Price Floor Price set above equilibrium Protect Producers Can't charge below the set price Causes surpluses


