Endocrinology in pregnancy: influence of maternal vitamin D status
advertisement

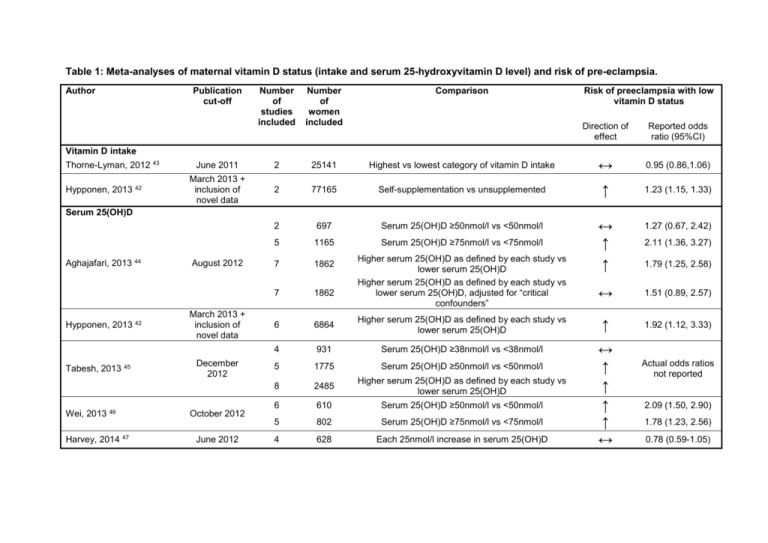
Table 1: Meta-analyses of maternal vitamin D status (intake and serum 25-hydroxyvitamin D level) and risk of pre-eclampsia. Author Publication cut-off Number of studies included Number of women included Comparison June 2011 2 25141 March 2013 + inclusion of novel data 2 Risk of preeclampsia with low vitamin D status Direction of effect Reported odds ratio (95%CI) Highest vs lowest category of vitamin D intake ↔ 0.95 (0.86,1.06) 77165 Self-supplementation vs unsupplemented ↑ 1.23 (1.15, 1.33) 2 697 Serum 25(OH)D ≥50nmol/l vs <50nmol/l 5 1165 Serum 25(OH)D ≥75nmol/l vs <75nmol/l 7 1862 7 1862 6 6864 4 Vitamin D intake Thorne-Lyman, 2012 43 Hypponen, 2013 42 Serum 25(OH)D Aghajafari, 2013 44 Hypponen, 2013 42 Tabesh, 2013 45 Wei, 2013 46 Harvey, 2014 47 August 2012 March 2013 + inclusion of novel data December 2012 October 2012 June 2012 Higher serum 25(OH)D as defined by each study vs lower serum 25(OH)D Higher serum 25(OH)D as defined by each study vs lower serum 25(OH)D, adjusted for “critical confounders” ↔ ↑ ↑ 1.27 (0.67, 2.42) 2.11 (1.36, 3.27) 1.79 (1.25, 2.58) ↔ 1.51 (0.89, 2.57) Higher serum 25(OH)D as defined by each study vs lower serum 25(OH)D ↑ 1.92 (1.12, 3.33) 931 Serum 25(OH)D ≥38nmol/l vs <38nmol/l 5 1775 Serum 25(OH)D ≥50nmol/l vs <50nmol/l 8 2485 Higher serum 25(OH)D as defined by each study vs lower serum 25(OH)D 6 610 Serum 25(OH)D ≥50nmol/l vs <50nmol/l 5 802 Serum 25(OH)D ≥75nmol/l vs <75nmol/l 4 628 Each 25nmol/l increase in serum 25(OH)D ↔ ↑ ↑ ↑ ↑ ↔ Actual odds ratios not reported 2.09 (1.50, 2.90) 1.78 (1.23, 2.56) 0.78 (0.59-1.05)