2046-4053-1-57-S1
advertisement
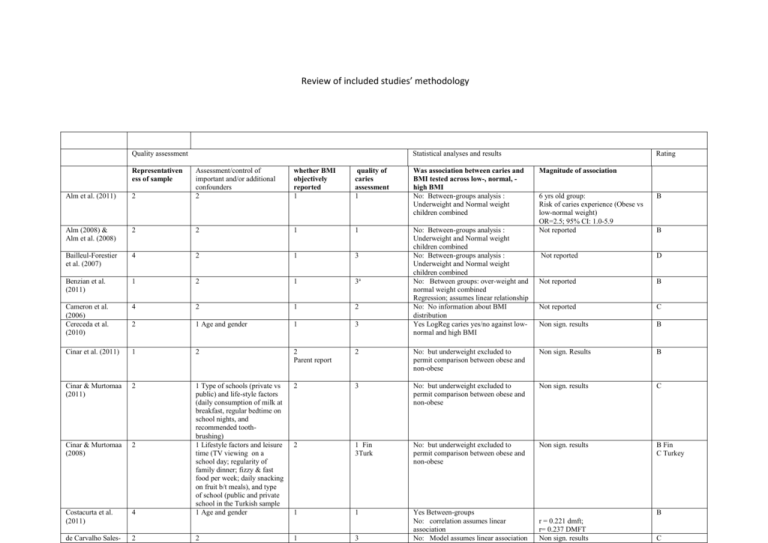
Review of included studies’ methodology Quality assessment Statistical analyses and results Alm et al. (2011) 2 Assessment/control of important and/or additional confounders 2 Alm (2008) & Alm et al. (2008) 2 2 1 1 Bailleul-Forestier et al. (2007) 4 2 1 3 Benzian et al. (2011) 1 2 1 3a Cameron et al. (2006) Cereceda et al. (2010) 4 2 1 2 2 1 Age and gender 1 3 Cinar et al. (2011) 1 2 2 Parent report 2 Cinar & Murtomaa (2011) 2 2 Cinar & Murtomaa (2008) 2 Costacurta et al. (2011) 4 1 Type of schools (private vs public) and life-style factors (daily consumption of milk at breakfast, regular bedtime on school nights, and recommended toothbrushing) 1 Lifestyle factors and leisure time (TV viewing on a school day; regularity of family dinner; fizzy & fast food per week; daily snacking on fruit b/t meals), and type of school (public and private school in the Turkish sample 1 Age and gender de Carvalho Sales- 2 Representativen ess of sample 2 whether BMI objectively reported 1 quality of caries assessment 1 Was association between caries and BMI tested across low-, normal, high BMI No: Between-groups analysis : Underweight and Normal weight children combined No: Between-groups analysis : Underweight and Normal weight children combined No: Between-groups analysis : Underweight and Normal weight children combined No: Between groups: over-weight and normal weight combined Regression; assumes linear relationship No: No information about BMI distribution Yes LogReg caries yes/no against lownormal and high BMI Rating Magnitude of association 6 yrs old group: Risk of caries experience (Obese vs low-normal weight) OR=2.5; 95% CI: 1.0-5.9 Not reported B Not reported D Not reported B Not reported C Non sign. results B No: but underweight excluded to permit comparison between obese and non-obese Non sign. Results B 3 No: but underweight excluded to permit comparison between obese and non-obese Non sign. results C 2 1 Fin 3Turk No: but underweight excluded to permit comparison between obese and non-obese Non sign. results B Fin C Turkey 1 1 Yes Between-groups No: correlation assumes linear association No: Model assumes linear association 1 3 B B r = 0.221 dmft; r= 0.237 DMFT Non sign. results C Peres et al. (2010) D’Mello et al. (2011) Dye et al. (2004) 4 1 Gender & ethnicity 1 2 No: Underweight not reported Non sign. results C 1 2 1 2 No: Underweight not reported Non sign. results B Floyd (2009) 2 1 Parental occupational category (labor, business, or whitecollar) and housing (older single-story row housing vs. newer multi-story dwellings) to the less affluent sample regression model 1 3 No: Regression model assumes a linear relationship Frisbee et al. (2010) Gerdin et al. (2008) 4 2 1 5 No: Underweight not reported Non sign. results D 1 1 Age, gender and socioeconomic status 1 1 No: Underweight not reported A Granville-Garcia et al. (2008) Hilgers et al. (2006) Hong et al. (2008) 1 1 3 No: Underweight not reported 4 1Type of school (private vs public) 1Age & gender For the LMR: Childhood BMI at 4 years of age: bvalue 0.048; SE: 0.020 Childhood BMI at 5 years of age: bvalue 0.050; SE:0.018 Childhood BMI at 7 years of age: bvalue 0.032; SE:0.013 Childhood BMI at 10 years of age: b-value 0.024; SE: 0.009 Non sign. results 1 1 Yes Not reported B 1 1Age and race 1 2 Not reported A Ismail et al. (2009) 3 1 1 2 Yes Between-groups No: Multivariate predictive models assumed linear association No: Model assumes linear association Not reported B Jamelli et al. (2010) 2 2 1 No details No: Model assumes linear association Non sign. results 5+ Juarez-Lopez & Villa-Ramos (2010) Jürgensen & Petersen (2009) KopyckaKedzierawski et al. (2008) 4 2 1 No details No: Underweight not reported Non sign. results 7+ 1 2 1 3 Yes Between-groups Non sign. results B 1 1 NHANES III, the logistic regression adjusted for sex, race/ethnicity, geographic region of the country, poverty status, level of education of the household 1 2 No: Underweight not reported Cohort III Ref group: Normal weight 6-11yrs primary caries OR (MLR): Overweight: 0.7 p =0.04 At risk:0.7 p =0.04 6-11yrs permanent caries OR (MLR): A B B head, time since last dental visit, and blood lead and cotinine levels Macek & Mitola (2006) 1 Marshall et al. (2007) 1 MartinezSotolongo & Martinez-Brito (2010) Modeer et al. (2009) Moreira et al. (2006) Narksawat et al. (2009) NHANES 1999–2002: logistic regression analyses adjusted for sex, race/ethnicity, last dental visit, poverty status, blood lead levels (below and above median) and serum cotinine levels. 1 Age, sex, race/ethnicity, poverty status Overweight: 0.6 p =0.03 At risk: Non sign. results 12-18 yrs OR (MLR): Overweight: 0.5 p =0.02 At risk: Non sign. results Cohort 1999-2002 Not sign at all ages A 1 2 Yes Between-group analysis Multiple logistic regression Non sign. results A 1 Age, child’s cumulative fluoride intake, mother’ education 1 3 No: Underweight not reported B 2 1Age and gender 1 3 No: Underweight not reported Predicting caries experience: Ref group: No caries Children ‘at risk’ of overweight OR 3.02 (CI 1.46, 6.25) Obese vs Normal weight against caries risk: OR = 28.2 (CI 15.788.2) 4 1 Parental country of birth, and educational level 1 1 No: Underweight not reported Caries experience DS (>0) as dependent variable: BMI-sds (P = 0.002, OR = 1.31) MLR: OR for BMI after analysis is adjusted for range of variables ranged OR 1.241.36 B 1 2 1 3 No: Underweight not reported Non sign. results B 1 1 Brushing frequency, use of fluoride toothpaste, having more than 3 snacks a day, having more than 2 dental visits a year, receiving oral health education every 3 months, residential area (urban/rural), age, gender 1Gender and number of dental visits in MLR 1 3a Yes Between-groups 1 3 No: Underweight not reported 1Mother’s education level 1 4 Yes Logistic regression Ngoenwiwatkul & Leela-Adisorn (2009) 4 Oliveira et al. 2 Yes Multiple Logistic regression B B OR for MLR: Risk caries experience of underweight vs overweight/obese (OR= 2.22; 95% CI= 1.20-4.09) Normal vs overweight/obese: (OR= 1.915; 95% CI=1.20-3.00) OR adjusted: Risk of underweight: Caries vs no caries OR = 1.031 (95% CI = 1.005-1.058) Risk caries Underweight: OR=3.20 C C (2008) 1.31-7.78) Overweight: OR=.60 (0.36-1.00) Not significant Pinto et al. (2007) 3 2 1 2 No: Underweight not reported Reifsnider et al. (2004) 4 1 4 No: HMR model assumed a linear relationship Pearson b/t ECC & BMI; r=0.20 hierarchical multiple regression (adjusted R^ =.21; F=7.13; p=.00). D Sadeghi et al. (2011) Sanchez-Perez et al. (2010) 2 1Mother's perception of condition of children's teeth, lack of transportation for dental care and Oral Health Needs Assessment scale (OHNA) 2 1 3 Non sign. results C 4 1Age at baseline, gender, number of primary teeth, and SE stratum 1 3 Yes Between-groups No: Model assumes linear association Yes Between-groups C Scheutz et al. (2007) 4 2 3 No: Overweight not reported Sharma & Hegde (2009) Sheller et al. (2009) 4 1 Lactobacilli, mutans streptococci, stimulated saliva flow rate, school, gender 2 dmfs at baseline compared to dmfs at follow up: Risk of being overweight (baseline) –0.12 (follow up –2.30) p = 0.032 Overweight: (baseline) ––2.01 (follow up –2.69) p = 0.035 Non sign. results 1 2 Yes Between-group Not reported C 1 1 No: Model assumes linear association Non sign. results B Tramini et al. (2009) 2 1 3 No: Underweight underrepresented (1.8%) Logistic regression predicting caries experience: BMI: 1.05 (1.00–1.10) B 4 1 Age, gender, ethnicity, Medicaid status in the adjusted multiple regression model 1 Gender, sugar consumption, soft drink consumption, type of school C C Poisson model 1.03 (1.01–1.05) Non sign. results C Tripathi et al. (2010) 4 1Type of school (private vs public) 1 3 No: Underweight and normal weight combined Van GemertSchriks et al. (2011) Vazquez-Nava et al. (2010) 4 2 1 3 No: Model assumes linear association Non sign. results D 2 1 3a No: Underweight not represented At-risk of caries at-risk of overweight (adjusted OR = 1.94; 95 percent CI = 1.30-2.89) and overweight children (adjusted OR = 1.95; 95 percent CI = 1.42-2.64) B Willerhausen et al. (2007a) Willershausen et 4 1 Adjusted for gender, sugar consumption, smoking in the home, bottle feeding, tooth brushing frequency gender, sugary product 1 Age and gender 1 2 Not reported C 4 2 1 2 Yes but underweight underrepresented (3.6%) Yes Not reported C al. (2007b) Willershausen et 4 1 Gender 1 2 No: Underweight and normal weight Not reported C al. (2004) combined Samples that involved forms of stratified or cluster sampling of countries or districts that ensured representation of a range of SES values were rated 1, samples that represented cities or towns using some form of cluster sampling (e.g., of schools) were ranked 2, samples of convenience with some randomisation involved in selection of participants were ranked 3, and sample of convenience without a random selection of participants were ranked 4.
