Answers to the Problems and Applications
advertisement
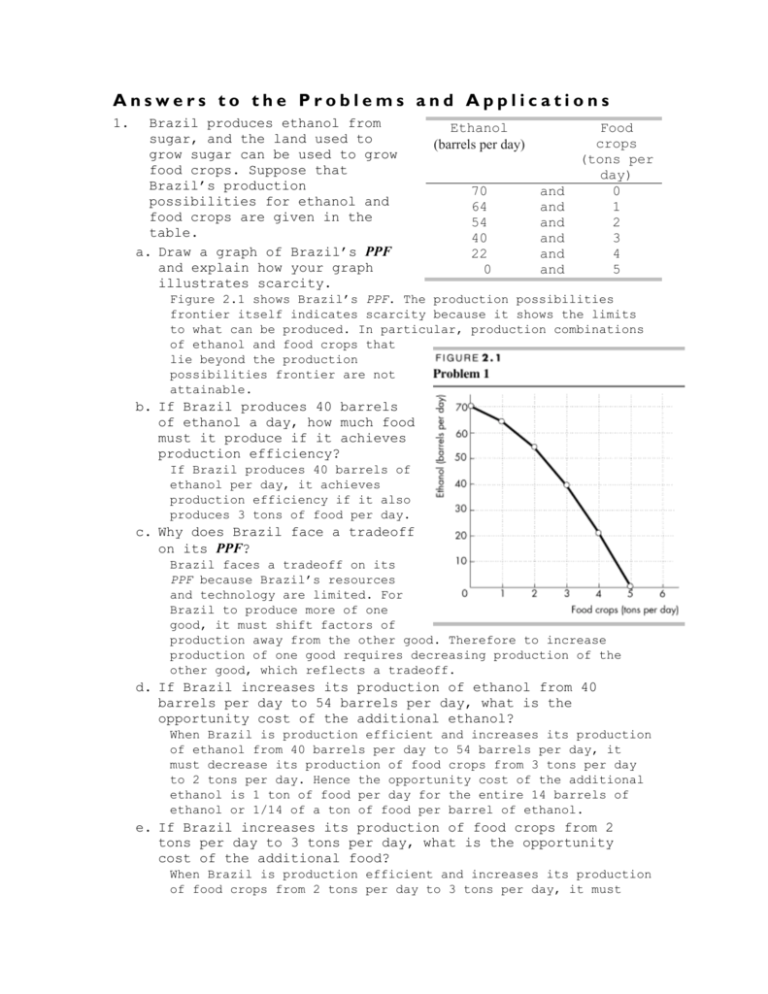
Answers to the Problems and Applications 1. Brazil produces ethanol from sugar, and the land used to grow sugar can be used to grow food crops. Suppose that Brazil’s production possibilities for ethanol and food crops are given in the table. a. Draw a graph of Brazil’s PPF and explain how your graph illustrates scarcity. Ethanol (barrels per day) 70 64 54 40 22 0 and and and and and and Food crops (tons per day) 0 1 2 3 4 5 Figure 2.1 shows Brazil’s PPF. The production possibilities frontier itself indicates scarcity because it shows the limits to what can be produced. In particular, production combinations of ethanol and food crops that lie beyond the production possibilities frontier are not attainable. b. If Brazil produces 40 barrels of ethanol a day, how much food must it produce if it achieves production efficiency? If Brazil produces 40 barrels of ethanol per day, it achieves production efficiency if it also produces 3 tons of food per day. c. Why does Brazil face a tradeoff on its PPF? Brazil faces a tradeoff on its PPF because Brazil’s resources and technology are limited. For Brazil to produce more of one good, it must shift factors of production away from the other good. Therefore to increase production of one good requires decreasing production of the other good, which reflects a tradeoff. d. If Brazil increases its production of ethanol from 40 barrels per day to 54 barrels per day, what is the opportunity cost of the additional ethanol? When Brazil is production efficient and increases its production of ethanol from 40 barrels per day to 54 barrels per day, it must decrease its production of food crops from 3 tons per day to 2 tons per day. Hence the opportunity cost of the additional ethanol is 1 ton of food per day for the entire 14 barrels of ethanol or 1/14 of a ton of food per barrel of ethanol. e. If Brazil increases its production of food crops from 2 tons per day to 3 tons per day, what is the opportunity cost of the additional food? When Brazil is production efficient and increases its production of food crops from 2 tons per day to 3 tons per day, it must decrease its production of ethanol from 54 barrels per day to 40 barrels per day. Hence the opportunity cost of the additional 1 ton of food crops is 14 barrels of ethanol. f. What is the relationship between your answers to d and e? The opportunity costs are reciprocals of each other. That is, the opportunity cost of 1 ton of food crops is 14 barrels of ethanol and the opportunity cost of 1 barrel of ethanol is 1/14 of a ton of food crops. g. Does Brazil face an increasing opportunity cost of ethanol? What feature of the PPF that you’ve drawn illustrates increasing opportunity cost? Brazil faces an increasing opportunity cost of ethanol production. For instance, when increasing ethanol production from 0 barrels per day to 22 barrels the opportunity cost of a barrel of ethanol is 1/22 of a ton of food while increasing ethanol production another 18 barrels per day (to a total of 40 barrels per day) has an opportunity cost of 1/18 of a ton of food per barrel of ethanol. The PPF’s bowed outward shape reflects the increasing opportunity cost. 2. Define marginal cost and use the information provided in the table in problem 1 to calculate the marginal cost of producing a ton of food when the quantity produced is 2.5 tons per day. The marginal cost of a good is the opportunity cost of producing one more unit of the good. When the quantity of food produced is 2.5 tons, the marginal cost of a ton of food is the opportunity cost of increasing the production of food from 2 tons per day to 3 tons per day. If this increase is carried out, the production of ethanol falls 54 barrels per day to 40 barrels per day, a decrease of14 barrels per day. The opportunity cost of increasing food production is the decrease in ethanol product, so the opportunity cost of producing a ton of food when 2.5 tons of food per day are produced is 14 barrels of ethanol per day. 3. Define marginal benefit, explain how it is measured, and explain why the information provided in the table in problem 1 does not enable you to calculate the marginal benefit of food. The marginal benefit of a good is the benefit received from consuming one more unit of the product. The marginal benefit of a good or service is measured by the most people are willing to pay for one more unit of it. The data in the table do not provide information on how much people are willing to pay for an additional unit of food. Hence the table has no information on the marginal benefit of food. 4. Distinguish between production efficiency and allocative efficiency. Explain why many production possibilities achieve production efficiency but only one achieves allocative efficiency. Production efficiency occurs when goods and services are produced at the lowest cost. This definition means that production efficiency occurs at any point on the PPF. Therefore all of the production points on the PPF are production efficient. Allocative efficiency occurs when goods and services are produced at the lowest cost and in the quantities that provide the greatest possible benefit. The allocatively efficient production point is the single point on the PPF that has the greatest possible benefit. 5. Harry enjoys tennis but wants a high grade in his economics course. Figure 2.2 shows the limits to what he can achieve: It is Harry’s PPF for these two “goods.” Figure 2.3 (on the next page) shows Harry’s MB curve for tennis. a. What is Harry’s marginal cost of tennis if he plays for (i) 3 hours a week; (ii) 5 hours a week; and (iii) 7 hours a week. (i) Harry’s marginal cost of an hour of tennis is 1.5 percentage points. When Harry increases the time he plays tennis from 2 hours to 4 hours, his grade in economics falls from 78 percent to 75 percent. His opportunity cost of these 2 additional hours of tennis is 3 percentage points, so his marginal cost of playing tennis for the third hour per week is 1.5 percentage points. (ii) Harry’s marginal cost of an hour of tennis is 2.5 percentage points. When Harry increases the time he plays tennis from 4 hours to 6 hours, his grade in economics falls from 75 percent to 70 percent. His opportunity cost of these 2 additional hours of tennis is 5 percentage points. So his marginal cost of playing tennis for the fifth hour per week is 2.5 percentage points. (iii) Harry’s marginal cost of an hour of tennis is 5 percentage points. When Harry increases the time he plays tennis from 6 hours to 8 hours, his grade in economics falls from 70 percent to 60 percent. His opportunity cost of these 2 additional hours of tennis is 10 percentage points. So his marginal cost of playing tennis for the seventh hour per week is 5 percentage points. b. If Harry uses his time to achieve allocative efficiency, what is his economics grade and how many hours of tennis does he play? Harry’s grade in economics is 66 percent and he plays tennis for 7 hours per week. From the answer to part (a), Harry’s marginal cost of playing the third hour a week of tennis is 1.5 percentage points, his marginal cost of playing tennis the fifth hour a week is 2.5 percentage points and his marginal cost of playing tennis the seventh hour a week is 5 percentage points. Plot these three opportunity costs in Figure 2.3 to create Harry’s marginal cost curve. Harry’s opportunity cost of playing tennis increases as he spends more time on tennis. Harry uses his time efficiently if he plays tennis for 7 hours a week because when he plays 7 hours a week his marginal benefit from the seventh hour of tennis, 5 percentage points, equals its marginal cost, also 5 percentage points. When Harry plays 7 hours of tennis, the PPF in Figure 2.2 shows that his grade in economics 66 percent. c. Explain why Harry would be worse off getting a grade higher than your answer to b. If Harry studied for enough hours to get a higher grade, he would have fewer hours to play tennis. Harry’s marginal benefit from tennis would be greater than his marginal cost, so he would be more efficient (better off) if he played more hours of tennis and took a lower grade. d. If Harry becomes a tennis superstar with big earnings from tennis, what happens to his PPF, MB curve, and efficient time allocation? If Harry becomes a tennis superstar, his PPF does not change. Harry’s PPF shows the grade he can produce for different hours of playing tennis and these production possibilities are unaffected by Harry’s superstar status. As a result Harry’s MC curve does not change. However Harry’s MB from playing tennis increases because of his big paydays so his MB curve shifts rightward. As a result, Harry’s efficient allocation of time now allocates more time to tennis (and results in a lower grade). e. If Harry suddenly finds high grades in economics easier to attain, what happens to his PPF, MB curve, and efficient time allocation? If Harry finds high grades to easier to attain his PPF shifts outward. In particular for every level of tennis playing his grade in economics is higher. As a result Harry’s marginal cost of earning a high grade in economics is reduced so that Harry’s MC curve shifts downward. Harry’s MB curve does not change because Harry’s marginal benefit from a high grade has not changed. Harry’s efficient time allocation results in Harry increasing the number of hours of tennis he plays. 6. A farm grows wheat and produces pork. The marginal cost of producing each of these products increases as more of it is produced. a. Make a graph that illustrates the farm’s PPF. The PPF is illustrated in Figure 2.4 as PPF0. Because the marginal cost of both wheat and pork increase as more of the product is produced, the PPF displays increasing opportunity cost so it has the “conventional” bowed outward shape. b. The farm adopts a new technology that allows it to use fewer resources to fatten pigs. Use your graph to illustrate the impact of the new technology on the farm’s PPF. The new technology rotates the PPF outward from PPF0 to PPF1. c. With the farm using the new technology described in b, has the opportunity cost of producing a ton of wheat increased, decreased, or remained the same? Explain and illustrate your answer. The opportunity cost of producing wheat has increased. The opportunity cost of a bushel of wheat is equal to the magnitude of the slopes of the PPFs illustrated in Figure 2.4. The slope of PPF1 has a larger magnitude than the slope of PPF0 so the opportunity cost of a bushel of wheat is higher along PPF1. Alternatively, the opportunity cost of increasing wheat product from 600 bushels per week to 800 bushels per week along PPF1 is 35 hundred pounds of pork but is only 20 hundred pounds of pork along PPF0. d. Is the farm more efficient with the new technology than it was with the old one? Why? The farm is able to produce more with the new technology than with the old, but it is not necessarily more efficient. If the farm was producing on its PPF before the new technology and after, the farm was production efficient both before the new technology and after. 7. In one hour, Sue can produce 40 caps or 4 jackets and Tessa can produce 80 caps or 4 jackets. a. Calculate Sue’s opportunity cost of producing a cap. Sue forgoes 4 jackets to produce 40 caps, so Sue’s opportunity cost of producing one cap is (4 jackets)/(40 caps) or 0.1 jacket per cap. b. Calculate Tessa’s opportunity cost of producing a cap. Tessa forgoes 4 jackets to produce 80 caps, so Tessa’s opportunity cost of producing one cap is (4 jackets)/(80 caps) or 0.05 jacket per cap. c. Who has a comparative advantage in producing caps? Tessa’s opportunity cost of a cap is lower than Sue’s opportunity cost, so Tessa has a comparative advantage in producing caps. d. If Sue and Tessa specialize in producing the good in which each of them has a comparative advantage, and they trade 1 jacket for 15 caps, who gains from the specialization and trade? Tessa specializes in caps and Sue specializes in jackets. Both Sue and Tessa gain from trade. Sue gains because she can obtain caps from Tessa at a cost of (1 jacket)/(15 caps), which is 0.067 jacket per cap, a cost that is lower than what it would cost her to produce caps herself. Tessa also gains from trade because she trades caps for jackets for 0.067 jacket per cap, which is higher than her cost of producing a cap. 8 Suppose that Tessa buys a new machine for making jackets that enables her to make 20 jackets an hour. (She can still make only 80 caps per hour.) a. Who now has a comparative advantage in producing jackets? Sue forgoes 40 caps to produce 4 jackets, so Sue’s opportunity cost of producing one jacket is (40 caps)/(4 jackets) or 10 caps per jacket. Tessa forgoes 80 caps to produce 20 jackets, so Tessa’s opportunity cost of producing one jacket is (80 caps)/(20 jackets) or 4 caps per jacket. Tessa has the comparative advantage in producing jackets because her opportunity cost of a jacket is lower than Sue’s opportunity cost. b. Can Sue and Tessa still gain from trade? Tessa and Sue can still gain from trade because Tessa (now) has a comparative advantage in producing jackets and Sue (now) has a comparative advantage in producing caps. Tessa will produce jackets and Sue will produce caps. c. Would Sue and Tessa still be willing to trade 1 jacket for 15 caps? Explain your answer. Sue and Tessa will not be willing to trade 1 jacket for 15 caps. In particular, Sue, whose comparative advantage lies in producing caps, can produce 1 jacket at an opportunity cost of only 10 caps. So Sue will be unwilling to pay any more than 10 caps per jacket. 9. “America’s baby-boomers are embracing tea for its health benefits,” said The Economist (July 8, 2005, p. 65). The article went on to say: “Even though the climate is suitable, teagrowing [in the United States] is simply too costly, since the process is labor-intensive and resists automation.” Using this information: a. Sketch a PPF for the production of tea and other goods and services in India. The PPF might be linear, though a more realistic PPF would be bowed out from the origin. The products along the two axes are tea and other goods and services. In Figure 2.5, tea is drawn along the horizontal axis but it could also be drawn along the vertical axis. b. Sketch a PPF for the production of tea and other goods and services in the United States. Again the PPF might be linear, though a more realistic PPF would be bowed out from the origin. As before, the products along the two axes are tea and other goods and services. Figure 2.6 (on the next page) illustrates the situation in the United States. Compared to India, the important point about the two PPFs is that the opportunity cost of producing tea is lower in India. If tea is measured along the horizontal axis, the magnitude of the slope of the PPF is equal to the opportunity cost of producing tea, so in this case the U.S. PPF would be steeper than the Indian PPF. If tea is measured along the vertical axis, then the Indian PPF would be steeper than the U.S. PPF. c. Sketch a marginal cost curve for the production of tea in India. The marginal cost curve for producing tea in India is illustrated in Figure 2.7. This marginal cost curve slopes upward. d. Sketch a marginal cost curve for the production of tea in the United States. The marginal cost curve for producing tea in the United States is also illustrated in Figure 2.7. Similar to the marginal cost curve for India, the U.S. marginal cost curve slopes upward. Because tea is less costly to produce in India than in the United States, the U.S. MC curve lies above the Indian MC curve. e. Sketch the marginal benefit curve for tea in the United States before and after the baby boomers began to appreciate the health benefits of tea. As Figure 2.8 shows, the downward sloping marginal benefit curve for tea shifts rightward after more baby-boomers start to appreciate tea. f. Explain why the United States does not produce tea and instead imports it from India. The United States imports tea from India because it is cheaper for the U.S. to import tea than to produce it in the United States. Fewer other goods and services must be given up to import tea than would be given up if the United States produced tea. g. Explain how the quantity of tea that achieves allocative efficiency has changed. The increase in the marginal benefit from tea increases the quantity of tea that achieves allocative efficiency. e. Does the change in preferences toward tea affect the opportunity cost of producing tea? If the PPF in India between tea and other goods and services is bowed out from the origin, increasing the production of tea raises the opportunity cost of producing tea. 10. Brazil produces ethanol from sugar at a cost of 83 cents per gallon. The United States produces ethanol from corn at a cost of $1.14 per gallon. Sugar grown on one acre of land produces twice the quantity of ethanol as the corn grown on an acre. The United States imports 5 percent of its ethanol consumption and produces the rest itself. Since 2003, U.S. ethanol production has more than doubled and U.S. corn production has increased by 45 percent. a. Does Brazil or the United States have a comparative advantage in producing ethanol? Brazil has a comparative advantage in producing ethanol. In Brazil $0.83 worth of other goods and services must be forgone to produce a gallon of ethanol whereas in the United States $1.14 of other goods and services must be forgone to produce a gallon of ethanol. b. Do you expect the opportunity cost of producing ethanol in the United States to have increased since 2003? Explain why. If there have been no technological changes in the production of ethanol, so that the PPF between ethanol and other goods and services has not shifted, then the opportunity cost of producing ethanol in the United States increased as more ethanol was produced. c. Sketch the PPF for ethanol and other goods and services for the United States. Figure 2.9 shows the U.S. PPF. For simplicity and in keeping with Figure 2.6 on p. 42 of the textbook, the PPF is linear. d. Sketch the PPF for ethanol and other goods and services for Brazil. Figure 2.10 shows the Brazilian PPF. For simplicity and in keeping with the Figure on p. 42 of the textbook, the PPF is linear. e. Sketch a figure similar to Fig. 2.6 on p. 42 to show how both the United States and Brazil can gain from specialization and trade. In general, the United States gains from trade with Brazil by importing ethanol from Brazil. Brazil produces ethanol at a lower opportunity cost than the United States, so the opportunity cost to the United States of consuming ethanol is lower if the United States consumes ethanol produced in Brazil. In Figure 2.9 initially the United States produced and consumed 400 billion units of other goods and services and 10 million gallons of ethanol. After specializing in the production of other goods and services and trading with Brazil, the United States produces 800 billion units of other goods and services. By trading 200 billion units of goods and services for 20 million gallons of ethanol, the United States consumes 600 billion units of other goods and services and 20 million gallons of ethanol. The consumption of both other goods and services and ethanol increases in the United States. The story in Brazil is similar. In Figure 2.10 prior to trade Brazil produced and consumed billion units of other goods and services and 20 million gallons of ethanol. After specializing in the production of ethanol (50 million gallons of ethanol) and trading with the United States (20 million gallons of ethanol in exchange for 200 billion units of other goods and services) Brazil consumes 200 billion units of other goods and services and 30 million gallons of ethanol. The consumption of both other goods and services and ethanol increases in Brazil. f. Do you think the United States has achieved production efficiency in its manufacture of ethanol? Explain why or why not. The United States has probably attained production efficiency. In the United States firms have the incentive to produce goods and services, such as ethanol, efficiently because the owners of firms have been given the property right to their firm’s profit. g. Do you think the United States has achieved allocative efficiency in its manufacture of ethanol? Explain why or why not. With the higher price of gasoline, the demand for ethanol and, as a result, the demand for the corn used to produce ethanol increased. The allocatively efficient quantity of both have increased. However the United States does not allow free trade in ethanol, which is why the U.S. price exceeds the Brazilian price. It is likely that the allocatively efficient quantity of U.S.-produced ethanol is less than the quantity actually produced in the United States. Most likely allocative efficiency requires that the United States should produce less ethanol, more other goods and services, and trade with Brazil because Brazil produces ethanol at lower cost than the United States. 11. For 50 years, Cuba has had a centrally planned economy in which the government makes the big decisions on how resources will be allocated. Why would you expect Cuba’s production possibilities (per person) to be smaller than those of the United States? What are the economic institutions that help the U.S. economy achieve allocative efficiency that Cuba might lack? Cuba’s economy is almost surely less efficient than the U.S. economy. Because owners of firms in the United States have been given the property rights to any profit their firm might earn, owners have the self-interested incentive to operate the firm efficiently and produce goods and services that consumers desire. In Cuba these incentives are absent because firms are not privately owned. As a result, no single person has the selfinterested incentive to either insure that firms produce goods and services efficiently or produce the goods and services that consumers desire. In other words, the U.S. economy with its property rights and markets has harnessed people’s self interest to produce goods and services efficiently and so the U.S. economy is likely much closer to allocative efficiency than is the Cuban economy.

