Probability Lesson Plan: Spinners & Fractions (Grade 5)
advertisement
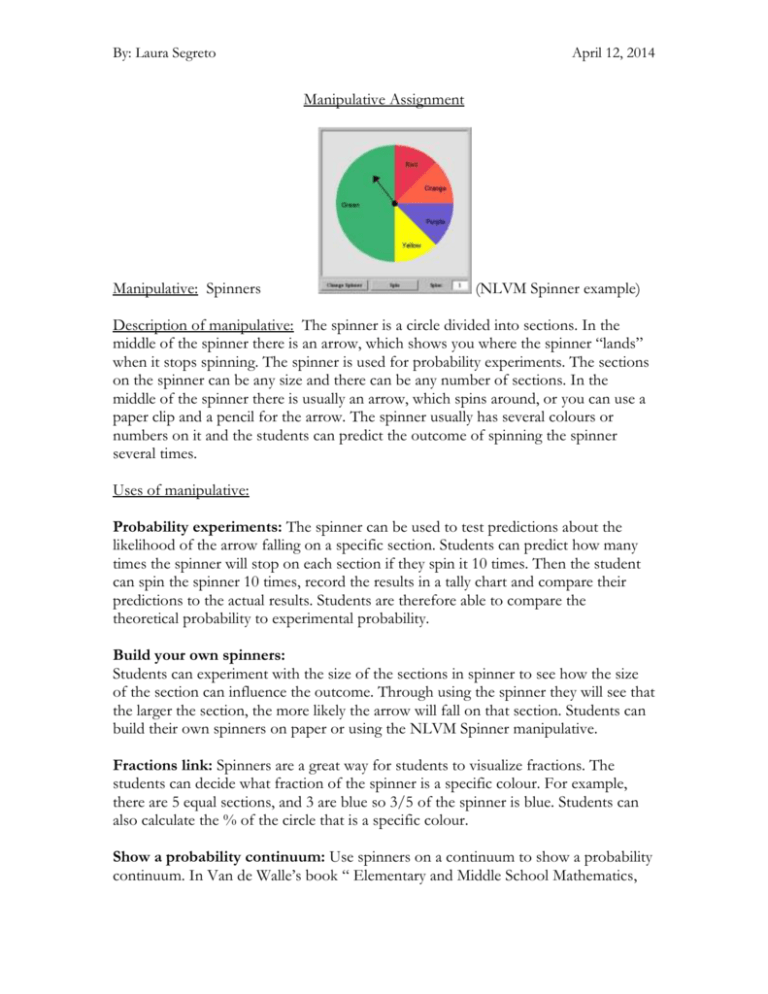
By: Laura Segreto April 12, 2014 Manipulative Assignment Manipulative: Spinners (NLVM Spinner example) Description of manipulative: The spinner is a circle divided into sections. In the middle of the spinner there is an arrow, which shows you where the spinner “lands” when it stops spinning. The spinner is used for probability experiments. The sections on the spinner can be any size and there can be any number of sections. In the middle of the spinner there is usually an arrow, which spins around, or you can use a paper clip and a pencil for the arrow. The spinner usually has several colours or numbers on it and the students can predict the outcome of spinning the spinner several times. Uses of manipulative: Probability experiments: The spinner can be used to test predictions about the likelihood of the arrow falling on a specific section. Students can predict how many times the spinner will stop on each section if they spin it 10 times. Then the student can spin the spinner 10 times, record the results in a tally chart and compare their predictions to the actual results. Students are therefore able to compare the theoretical probability to experimental probability. Build your own spinners: Students can experiment with the size of the sections in spinner to see how the size of the section can influence the outcome. Through using the spinner they will see that the larger the section, the more likely the arrow will fall on that section. Students can build their own spinners on paper or using the NLVM Spinner manipulative. Fractions link: Spinners are a great way for students to visualize fractions. The students can decide what fraction of the spinner is a specific colour. For example, there are 5 equal sections, and 3 are blue so 3/5 of the spinner is blue. Students can also calculate the % of the circle that is a specific colour. Show a probability continuum: Use spinners on a continuum to show a probability continuum. In Van de Walle’s book “ Elementary and Middle School Mathematics, By: Laura Segreto April 12, 2014 Teaching Developmentally” Figure 23.4 shows how spinners are used as a visual to show the difference along the continuum from impossible to possible. Discover how probability outcomes change based on number of spins: Using the NLVM Spinner, students can compare the outcomes on a spinner after 10 spins to 100 spins. It would be unrealistic to ask the students to spin a paperclip 100 times on a spinner, but with the NLVM spinner, with 1 click, the results up to 999 spins can be shown. Students can record the results after 10 spins and then after 100 spins and compare. They will notice that the more times you spin, the closer the results are to the theoretical probability. 3 Part Lesson for Probability –Spinner TDSB Dewson St. PS Lesson Title – Using Spinners To Explore Probability Date Grade( s) 5 Learning Goal (Curriculum Expectations) – represent, using a common fraction, the probability that an event will occur in simple games and probability experiments (e.g., “My spinner has four equal sections and one of those sections is coloured red. The probability that I will land on red is ¼) – pose and solve simple probability problems, and solve them by conducting probability experiments and selecting appropriate methods of recording the results (e.g., tally chart, line plot, bar graph) Lesson Components Anticipated Student Responses Part 1: Minds On (10 minutes) Possible student Responses: Show a spinner with unequal sections like the one above. Ask the students to write 2 sentences about the spinner using the probability vocabulary from the math word wall and to explain their thinking. -Red is more likely than blue. -Blue is more likely than green. -There are 3 colours -The probability that the spinners lands on red is ½ because half of the spinner is red - The probability that the spinners lands on Green is 1/6 because if you divide the spinner into 6, the sections would be the same size as the green section - The probability that the spinners lands on Blue is 2/6 because green is 1/6 and blue is 2 greens By: Laura Segreto Students share their sentences with the class April 12, 2014 -Blue is twice as likely as green Success criteria: -I can find the fraction to represent each section on the spinner -I can predict the possible outcomes of spinning a spinner 10 times Part 2: Hands On (25 minutes) Strategies: Make a picture Keep track using a tally chart Students are sent in partners onto the computers to the Spinner on the National Library of Virtual Manipulatives (http://nlvm.usu.edu/en/nav/frames_asid_186_g_2_t_5.html?open=act ivities&from=category_g_2_t_5.html) Tools: Students are to click on “Change Spinner” to change the size of the sections in their spinner. They are allowed to change the sections any way they want. Students replicate the virtual spinner they have just designed by drawing it into their workbook. Students must make a prediction for the outcome based on spinning the spinner 10 times. Students are asked to write down the fraction for each section. Students click on “Record Results” to have the results of their 10 spins tabulate in a chart. Students click “Spin” 10 times. Students write down the outcomes in a tally chart in their notebooks. Students could also print out their spinner and the table that was automatically tabulated. Paper/pencil Computers & NLVM link in shared file Once the students have hit spin 10 times, students can change the number of turns to 100 and watch the results appear. Students are to compare the results from 10 spins to the results of 100 spins. If time permits, students can reset the spinner and change the sizes of the sections and re-spin for 10 and 100 spins. Part 3: Consolidation (20 minutes) Bansho – Students are going to post up their drawings of their spinners and their results on the board and share their findings with the class. (Students could also print their spinners out and print out the computer-generated table). Questions the teacher will ask each group: 1) Describe your spinner (Possible answer: there are 4 equal sections) 2) What did you look at to help you make your predictions? 3) Were your predictions close to what actually happened? Misconceptions: - Do not understand probability as a fraction - - may not see the link between the size of the section and the increase in likelihood of the spinner stopping on the section may not understand the difference between By: Laura Segreto 4) Were you surprised by the outcomes? At 10 turns? At 100 turns? After (Practice) Students are provided with the link to the Spinner via the NLV for further experimentation / exploration at home A similar spinner is available at http://illuminations.nctm.org/adjustablespinner/. The spinner on the illuminations website can go up to 99 999 spins! As a practice, students could show their parents at home how they can build the spinner and predict the outcomes. April 12, 2014 theoretical probability and experimental probability yet
