See No Evil, Hear No Evil name, date, hour: p. 18 You will perform
advertisement
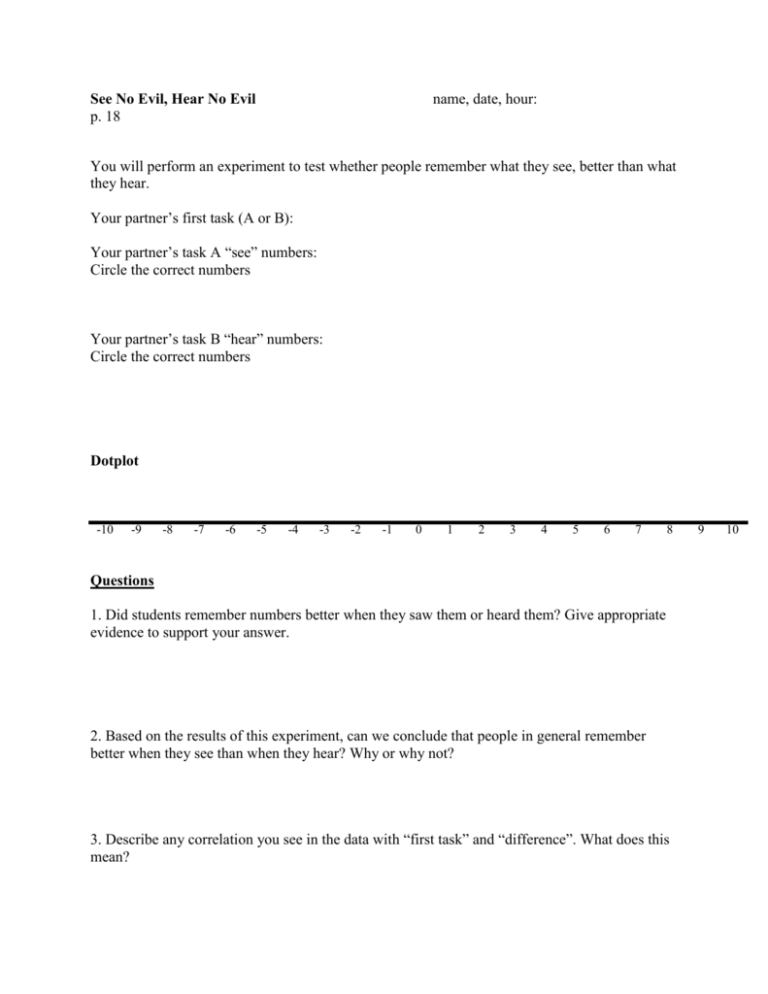
See No Evil, Hear No Evil p. 18 name, date, hour: You will perform an experiment to test whether people remember what they see, better than what they hear. Your partner’s first task (A or B): Your partner’s task A “see” numbers: Circle the correct numbers Your partner’s task B “hear” numbers: Circle the correct numbers Dotplot -10 -9 -8 -7 -6 -5 -4 -3 -2 -1 0 1 2 3 4 5 6 7 8 Questions 1. Did students remember numbers better when they saw them or heard them? Give appropriate evidence to support your answer. 2. Based on the results of this experiment, can we conclude that people in general remember better when they see than when they hear? Why or why not? 3. Describe any correlation you see in the data with “first task” and “difference”. What does this mean? 9 10 12 61 25 88 60 24 55 94 63 40 18 27 43 24 97 25 29 9 83 74 90 44 78 61 82 59 51 95 23 14 21 36 90 74 99 35 92 15 80 63 64 55 81 36 82 12 85 69 2 19 30 52 14 38 17 21 87 84 54 41 27 8 36 47 59 86 63 19 96 59 43 4 86 65 91 72 3 19 70 12 73 49 53 93 55 29 27 54 56 15 79 69 58 33 45 73 27 57 10 21 86 24 19 28 36 61 35 40 13 74 70 91 36 78 48 67 36 12 79 81 99 50 30 4 4 63 57 68 25 96 30 64 67 53 68 75 25 68 93 80 29 94 63 89 67 96 77 27 4 52 92 3 15 7 5 25 14 79 98 50 15 78 22 90 78 97 30 96 82 19 100 97 35 67 44 72 33 68 87 39 8 99 9 71 50 76 44 68 41 67 32 14 2 26 2 75 73 12 49 40 68 21 64 100 32 27 92 7 24 89 26 29 87 33 71 16 55 79 87 7 72 43 77 21 34 82 44 56 55 44 37 89 46 100 43 10 86 30 33 32 55 34 20 83 17 15 92 35 82 40 82 40 76 41 47 11 74 57 47 51 92 6 69 97 28 78 69 91 42 94 70 38 34 82 72 5 13 56 79 20 43 41 38 76 40 47 10 34 14 64 84 55 31 94 19 22 4 39 25 66 17 21 38 31 79 29 54 59 33 40 68 88 93 99 13 91 88 90 78 76 34 59 3 23 91 15 68 8 8 47 9 47 48 79 99 68 21 87 64 46 65 5 56 22 39 18 35 39 39 54 81 22 98 49 7 39 3 67 62 70
