Math 116 – 02: Test #2 (Chapters 6 – 8) Name: Show work when
advertisement
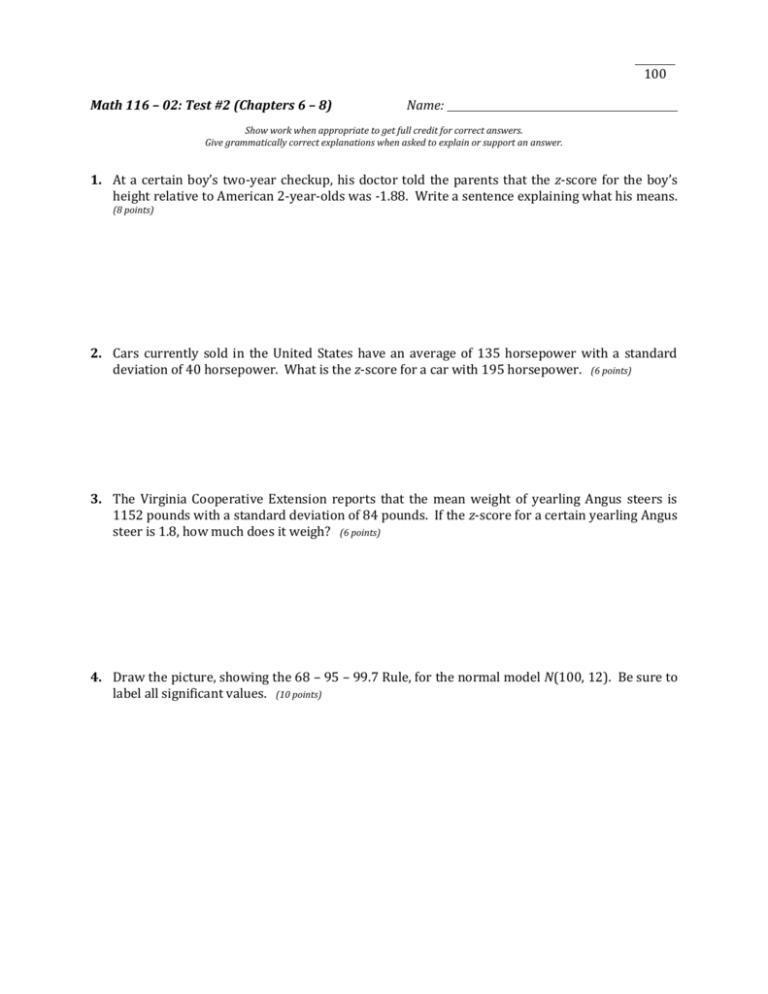
100 Math 116 – 02: Test #2 (Chapters 6 – 8) Name: Show work when appropriate to get full credit for correct answers. Give grammatically correct explanations when asked to explain or support an answer. 1. At a certain boy’s two-year checkup, his doctor told the parents that the z-score for the boy’s height relative to American 2-year-olds was -1.88. Write a sentence explaining what his means. (8 points) 2. Cars currently sold in the United States have an average of 135 horsepower with a standard deviation of 40 horsepower. What is the z-score for a car with 195 horsepower. (6 points) 3. The Virginia Cooperative Extension reports that the mean weight of yearling Angus steers is 1152 pounds with a standard deviation of 84 pounds. If the z-score for a certain yearling Angus steer is 1.8, how much does it weigh? (6 points) 4. Draw the picture, showing the 68 – 95 – 99.7 Rule, for the normal model N(100, 12). Be sure to label all significant values. (10 points) 5. From a sample taken in a certain woods, the mean diameter of trees was found to be 10.4 inches with a standard deviation of 4.7 inches. Assume that the histogram of the data was approximately normal in shape. (5 points each) (a) What range of diameters is “within 1.4 standard deviations of the mean”? (b) About what percent of trees have diameter between 15.1” and 19.8”? (c) About what percent of trees have diameter between 5.7” and 10.4”? (d) About what percent of trees have diameter less than 1”? (e) What diameters make up the 84th percentile? 6. Each of the following scatter plots has a correlation coefficient of -1, -0.85, 0.15, 0.85, or 1. Label each with the correct value. (2 points each) (a) (b) 3.5 3.5 3 3 2.5 2.5 2 2 1.5 1.5 1 1 0.5 0.5 0 0 5 0 10 0 5 10 r= r= (c) (d) 3.5 3.5 3 3 2.5 2.5 2 2 1.5 1.5 1 1 0.5 0.5 0 0 0 5 10 r= 0 5 10 r= 7. For each of the following pairs of variables, indicate whether you would expect positive correlation, negative correlation, or correlation close to 0. (3 points each) (a) maximum daily temperature and heating costs (b) Shoe size and number of siblings (c) Height and wingspan (d) Amount of time studied for a test and score on test 8. The following data on x = score on a measure of anxiety (higher values of x indicate higher levels of anxiety) and y = exam score were obtained for a sample of 9 students. x 23 14 14 0 17 20 20 15 21 y 43 59 48 77 50 52 46 51 51 (a) Sketch the scatter plot for this data. Does there seem to be a linear relationship between the two variables? (5 points) (b) Find the regression equation and the correlation coefficient. Round numbers to 3 decimal places. (10 points) (c) Use the regression model to predict the score for an anxiety score of 18.5 and for an anxiety score of 35. Which of these predictions is more credible? Why? (10 points)
