Funding Allocation for Financial Crisis and Material Aid
advertisement
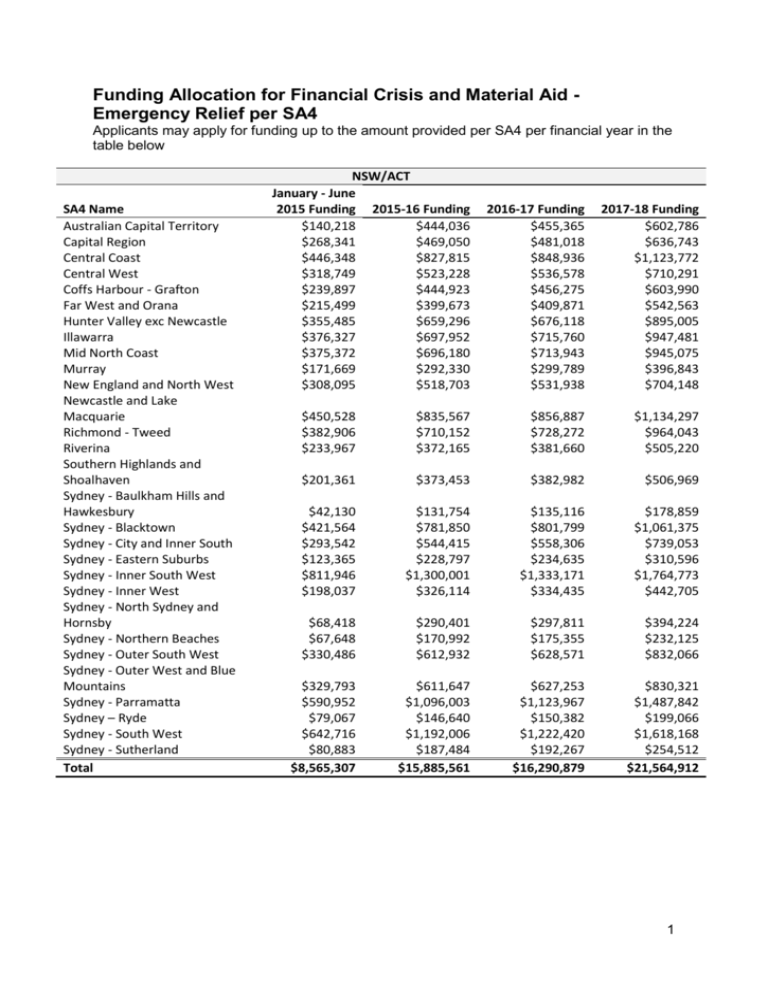
Funding Allocation for Financial Crisis and Material Aid Emergency Relief per SA4 Applicants may apply for funding up to the amount provided per SA4 per financial year in the table below SA4 Name Australian Capital Territory Capital Region Central Coast Central West Coffs Harbour - Grafton Far West and Orana Hunter Valley exc Newcastle Illawarra Mid North Coast Murray New England and North West Newcastle and Lake Macquarie Richmond - Tweed Riverina Southern Highlands and Shoalhaven Sydney - Baulkham Hills and Hawkesbury Sydney - Blacktown Sydney - City and Inner South Sydney - Eastern Suburbs Sydney - Inner South West Sydney - Inner West Sydney - North Sydney and Hornsby Sydney - Northern Beaches Sydney - Outer South West Sydney - Outer West and Blue Mountains Sydney - Parramatta Sydney – Ryde Sydney - South West Sydney - Sutherland Total NSW/ACT January - June 2015 Funding 2015-16 Funding $140,218 $444,036 $268,341 $469,050 $446,348 $827,815 $318,749 $523,228 $239,897 $444,923 $215,499 $399,673 $355,485 $659,296 $376,327 $697,952 $375,372 $696,180 $171,669 $292,330 $308,095 $518,703 2016-17 Funding $455,365 $481,018 $848,936 $536,578 $456,275 $409,871 $676,118 $715,760 $713,943 $299,789 $531,938 2017-18 Funding $602,786 $636,743 $1,123,772 $710,291 $603,990 $542,563 $895,005 $947,481 $945,075 $396,843 $704,148 $450,528 $382,906 $233,967 $835,567 $710,152 $372,165 $856,887 $728,272 $381,660 $1,134,297 $964,043 $505,220 $201,361 $373,453 $382,982 $506,969 $42,130 $421,564 $293,542 $123,365 $811,946 $198,037 $131,754 $781,850 $544,415 $228,797 $1,300,001 $326,114 $135,116 $801,799 $558,306 $234,635 $1,333,171 $334,435 $178,859 $1,061,375 $739,053 $310,596 $1,764,773 $442,705 $68,418 $67,648 $330,486 $290,401 $170,992 $612,932 $297,811 $175,355 $628,571 $394,224 $232,125 $832,066 $329,793 $590,952 $79,067 $642,716 $80,883 $8,565,307 $611,647 $1,096,003 $146,640 $1,192,006 $187,484 $15,885,561 $627,253 $1,123,967 $150,382 $1,222,420 $192,267 $16,290,879 $830,321 $1,487,842 $199,066 $1,618,168 $254,512 $21,564,912 1 SA4 Name Brisbane - East Brisbane - North Brisbane - South Brisbane - West Brisbane Inner City Cairns Darling Downs - Maranoa Fitzroy Gold Coast Ipswich Logan - Beaudesert Mackay Moreton Bay - North Moreton Bay - South Queensland - Outback Sunshine Coast Toowoomba Townsville Wide Bay Total Queensland January - June 2015 Funding 2015-16 Funding $181,821 $337,212 $164,032 $304,221 $242,969 $450,619 $48,340 $89,654 $93,183 $172,821 $336,030 $623,214 $196,102 $363,699 $265,854 $493,064 $547,712 $1,015,809 $433,613 $804,196 $407,270 $755,339 $178,828 $331,662 $349,729 $648,621 $99,725 $184,953 $142,279 $263,876 $358,366 $664,639 $178,146 $330,397 $268,802 $498,530 $534,107 $990,575 $5,026,907 $9,323,103 2016-17 Funding $345,816 $311,983 $462,117 $91,941 $177,231 $639,116 $372,979 $505,645 $1,041,727 $824,715 $774,611 $340,124 $665,170 $189,672 $270,609 $681,598 $338,827 $511,250 $1,015,850 $9,560,981 2017-18 Funding $457,771 $412,985 $611,723 $121,707 $234,608 $846,024 $493,728 $669,343 $1,378,977 $1,091,709 $1,025,385 $450,236 $880,513 $251,077 $358,216 $902,259 $448,519 $676,763 $1,344,722 $12,656,267 SA4 Name Adelaide - Central and Hills Adelaide - North Adelaide - South Adelaide - West Barossa - Yorke - Mid North South Australia - Outback South Australia - South East Total South Australia January - June 2015 Funding 2015-16 Funding $197,039 $365,436 $606,565 $1,124,959 $358,334 $664,580 $334,471 $620,324 $173,898 $322,518 $150,021 $278,234 $306,062 $567,634 $2,126,388 $3,943,685 2016-17 Funding $374,760 $1,153,662 $681,537 $636,151 $330,747 $285,333 $582,117 $4,044,307 2017-18 Funding $496,085 $1,527,150 $902,178 $842,100 $437,823 $377,707 $770,573 $5,353,617 SA4 Name Hobart Launceston and North East South East West and North West Total Tasmania January - June 2015 Funding 2015-16 Funding $264,289 $648,910 $218,304 $378,545 $66,005 $69,304 $202,362 $296,001 $750,959 $1,392,760 2016-17 Funding $665,467 $388,203 $71,072 $303,553 $1,428,296 2017-18 Funding $880,906 $513,881 $94,081 $401,826 $1,890,694 2 Victoria SA4 Name Ballarat Bendigo Geelong Hume Latrobe - Gippsland Melbourne - Inner Melbourne - Inner East Melbourne - Inner South Melbourne - North East Melbourne - North West Melbourne - Outer East Melbourne - South East Melbourne - West Mornington Peninsula North West Shepparton Warrnambool and South West Total SA4 Name Bunbury Mandurah Perth - Inner Perth - North East Perth - North West Perth - South East Perth - South West Western Australia - Outback Western Australia - Wheat Belt Total SA4 Name Darwin Northern Territory - Outback Total January - June 2015 Funding $215,769 $195,367 $277,462 $231,340 $397,151 $394,662 $136,301 $163,177 $442,457 $418,145 $332,572 $796,853 $848,598 $303,112 $259,139 $216,514 $173,437 $5,802,058 2015-16 Funding $400,175 $362,336 $514,592 $429,053 $736,572 $731,956 $252,789 $302,635 $820,599 $775,508 $616,801 $1,477,875 $1,573,843 $562,164 $480,609 $401,556 $321,664 $10,760,728 2016-17 Funding $410,385 $371,581 $527,722 $440,000 $755,366 $750,632 $259,239 $310,357 $841,536 $795,295 $632,539 $1,515,582 $1,613,999 $576,508 $492,872 $411,802 $329,871 $11,035,286 2017-18 Funding $543,244 $491,877 $698,567 $582,446 $999,909 $993,642 $343,166 $410,832 $1,113,976 $1,052,765 $837,318 $2,006,239 $2,136,518 $763,147 $652,435 $545,119 $436,664 $14,607,866 Western Australia January - June 2015 Funding 2015-16 Funding $197,910 $296,447 $119,746 $197,631 $49,248 $748,480 $225,492 $312,916 $351,304 $535,252 $427,059 $617,598 $304,796 $329,386 $293,827 $675,241 2016-17 Funding $304,011 $202,674 $767,577 $320,900 $548,909 $633,356 $337,790 $692,469 2017-18 Funding $402,432 $268,288 $1,016,073 $424,789 $726,613 $838,400 $447,146 $916,650 $288,212 $4,001,163 $295,566 $4,103,252 $391,253 $5,431,645 Northern Territory January - June 2015 Funding 2015-16 Funding $292,826 $507,565 $457,174 $792,435 $750,000 $1,300,000 2016-17 Funding $547,000 $853,000 $1,400,000 2017-18 Funding $585,651 $914,349 $1,500,000 $187,998 $2,157,380 3
