Science & Psychology
advertisement
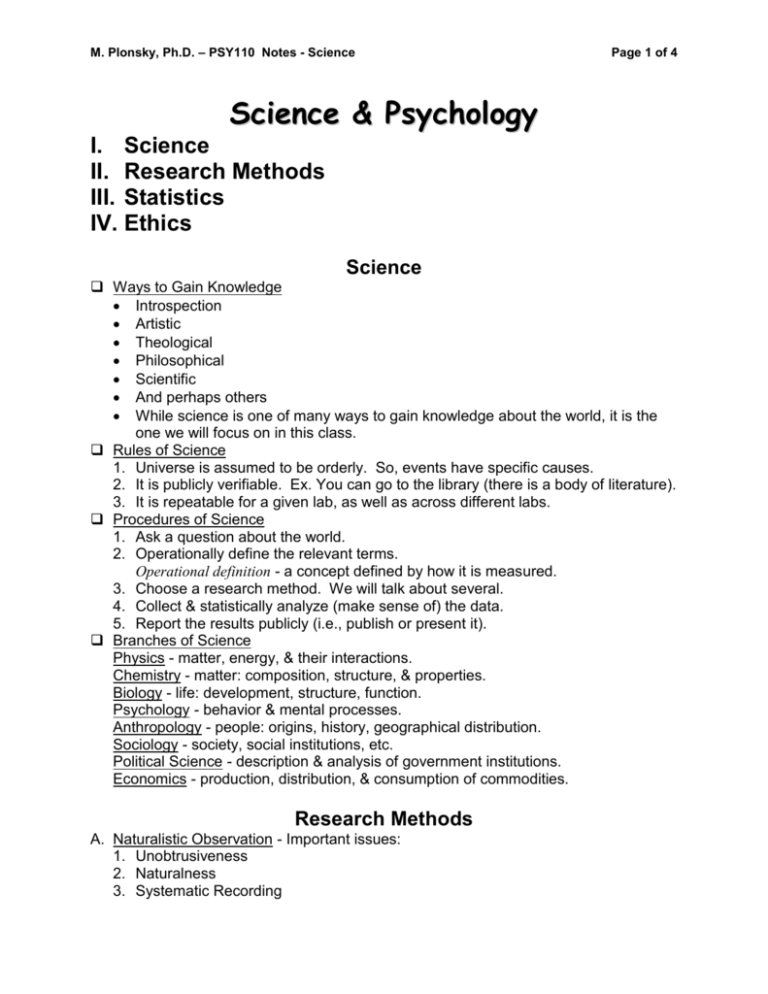
M. Plonsky, Ph.D. – PSY110 Notes - Science Page 1 of 4 Science & Psychology I. Science II. Research Methods III. Statistics IV. Ethics Science Ways to Gain Knowledge Introspection Artistic Theological Philosophical Scientific And perhaps others While science is one of many ways to gain knowledge about the world, it is the one we will focus on in this class. Rules of Science 1. Universe is assumed to be orderly. So, events have specific causes. 2. It is publicly verifiable. Ex. You can go to the library (there is a body of literature). 3. It is repeatable for a given lab, as well as across different labs. Procedures of Science 1. Ask a question about the world. 2. Operationally define the relevant terms. Operational definition - a concept defined by how it is measured. 3. Choose a research method. We will talk about several. 4. Collect & statistically analyze (make sense of) the data. 5. Report the results publicly (i.e., publish or present it). Branches of Science Physics - matter, energy, & their interactions. Chemistry - matter: composition, structure, & properties. Biology - life: development, structure, function. Psychology - behavior & mental processes. Anthropology - people: origins, history, geographical distribution. Sociology - society, social institutions, etc. Political Science - description & analysis of government institutions. Economics - production, distribution, & consumption of commodities. Research Methods A. Naturalistic Observation - Important issues: 1. Unobtrusiveness 2. Naturalness 3. Systematic Recording M. Plonsky, Ph.D. – PSY110 Notes - Science B. C. D. E. Page 2 of 4 Frequency - How many times does the behavior occur. Duration - How long does the behavior last. Latency - How much time passes until the behavior occurs. Time Sampling – involves cycles of each animal being looked at regular intervals in sequence. Surveys Includes: Questionnaires - without human contact. Interviews - voice or face-to-face contact. Important issues: Question Structure - Should not be leading. Who is Surveyed? - Should use a random sample (each member of the population has an equal chance of being in the sample). Case Studies Used a lot by clinicians. Is basically a detailed study of the cohort (a person or group of people of interest). Are several types: Retrospective - looks back at past events. Adv: easy. Disadv: memory is poor. Longitudinal/Proactive - follows events as they occur. Adv: accurate. Disadv: expensive (money & time). Cross Sectional - involves studying different age groups. Adv: can see developmental progression. Disadv: generation effects. Mixed Longitudinal Design - uses cross sectional technique, but observes for a period of time. Test Methods A way to operationally defines variables. Examples include: IQ test - Intelligence Quotient TMAS - Taylor Manifest Anxiety Scale BDI – Beck Depression Interview SOS - Sexual Opinion Survey ACT - American College Testing Assessment Test Experiments Involves manipulating something we choose. As a result, it is the most powerful method because it allows us to determine cause & effect. Purpose is to see if one variable causes changes in another. Definitions Variable - Characteristic of a person or thing that can occur in different amounts or kinds. Independent Variables (IVs) - We select and manipulate these. Dependent Variables (DVs) - We measure these. Extraneous Variables or Confounding Variables (EVs) - Variables other than the IV which can influence the DV. We worry about these. M. Plonsky, Ph.D. – PSY110 Notes - Science Page 3 of 4 Advanced Factorial Designs - employ >1 IV. Ex. Weil, Zinberg, & Nelson, 1968 Meta Analyses - combines the results of a large number of experiments on the same topic. Statistics Many people use statistics in much the same way as a drunkard uses a lamp pole; more for support than for illumination. Distributions – Data (collections of numbers that represent info). All have 3 characteristics: 1. Shape Refers to what the distribution looks like when it is plotted. Some examples include: Normal Positive Skew Negative Skew 2. Central Tendency Refers to the average or single score that best represents all the scores. Are several measures, including: Mean - Sum of the scores divided by the number of them. Is sensitive to every score. Median - Middle score; cuts the distribution in half. Mode - Most frequently occurring score. 3. Variability Refers to how much the scores differ from each other. Are several measures, including: Range - The highest minus the lowest score. R = XH - XL Standard Deviation - More complicated, but a better measure. Examples Significance of Differences In an experiment with 2 groups, there are 2 reasons why differences may occur. 1. Independent Variable (or treatment effect) 2. Chance (or sampling error) Statistics helps us to decide whether the difference is due to the IV (significant). Important concepts: Probability (p) of difference do to chance. Ranges from 0 to 1. Alpha level () - arbitrary level chosen to separate probable from improbable. The Test - determines the p that a given difference is due to chance. If the p , the difference is significant (or reliable). Be careful because figures can “lie”. The statistical test says whether the difference is worth paying attention to, not how impressive the figure makes the difference look. Correlation Refers to a relationship between variables (i.e., whether they “go together”). Correlation Coefficient - measures quantitatively the extent to which 2 variables are related. M. Plonsky, Ph.D. – PSY110 Notes - Science Page 4 of 4 One common example is Pearson r. Is illustrated with a scatterplot (a collection of pairs of scores). Examples: 1, 2, 3, 4, 5, 6 & Summary Correlation & Causality Possibilities - Let: A = TV violence, B = Real life violence, C = another variable (e.g., stress). 1. A B 2. A B 3. etc Thus, correlation tells us nothing about causality (e.g., correlation causality). Summary Sign Number ± (0 1) r= Direction Magnitude The sign of the number gives the direction of the correlation & a larger number means more of a correlation. Ethics Human Participants - Institutional Review Board (IRB). Deception, informed consent, stress, & confidentiality are issues. Animal Subjects - Institutional Animal Care & Use Committee (IACUC). Pain, stress, & privation are issues. In all cases a Cost/Benefit Analysis is used. Benefit Cost Low High Low maybe? don’t do it High do it! tough decision

