Reculver Fieldwork write-up 2015
advertisement
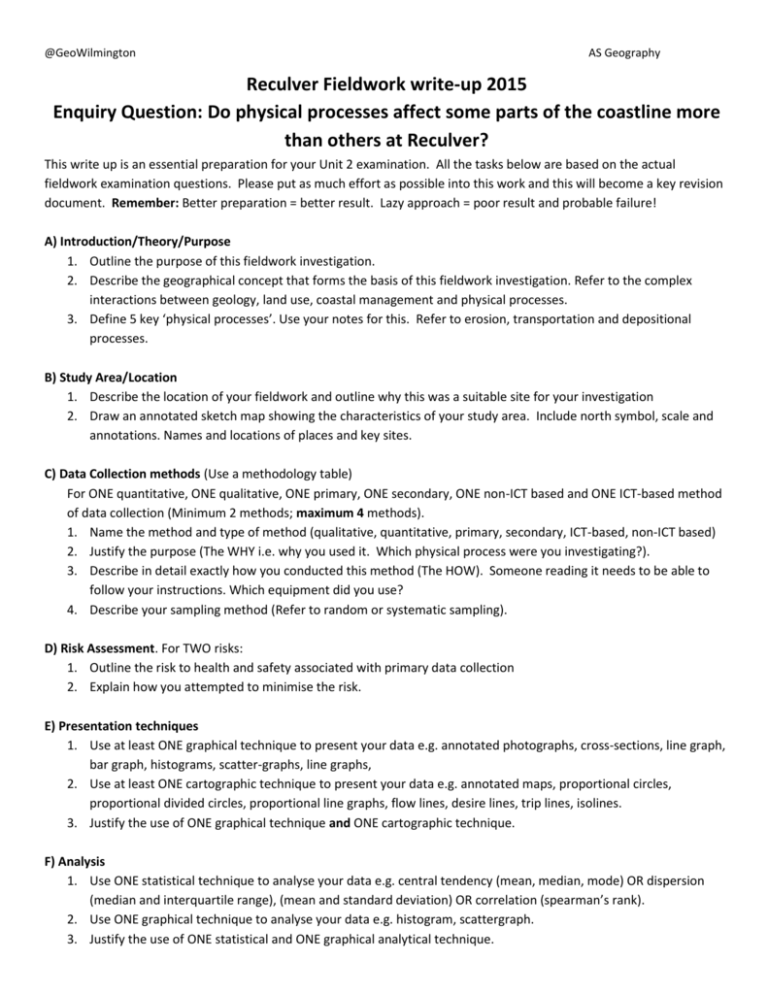
@GeoWilmington AS Geography Reculver Fieldwork write-up 2015 Enquiry Question: Do physical processes affect some parts of the coastline more than others at Reculver? This write up is an essential preparation for your Unit 2 examination. All the tasks below are based on the actual fieldwork examination questions. Please put as much effort as possible into this work and this will become a key revision document. Remember: Better preparation = better result. Lazy approach = poor result and probable failure! A) Introduction/Theory/Purpose 1. Outline the purpose of this fieldwork investigation. 2. Describe the geographical concept that forms the basis of this fieldwork investigation. Refer to the complex interactions between geology, land use, coastal management and physical processes. 3. Define 5 key ‘physical processes’. Use your notes for this. Refer to erosion, transportation and depositional processes. B) Study Area/Location 1. Describe the location of your fieldwork and outline why this was a suitable site for your investigation 2. Draw an annotated sketch map showing the characteristics of your study area. Include north symbol, scale and annotations. Names and locations of places and key sites. C) Data Collection methods (Use a methodology table) For ONE quantitative, ONE qualitative, ONE primary, ONE secondary, ONE non-ICT based and ONE ICT-based method of data collection (Minimum 2 methods; maximum 4 methods). 1. Name the method and type of method (qualitative, quantitative, primary, secondary, ICT-based, non-ICT based) 2. Justify the purpose (The WHY i.e. why you used it. Which physical process were you investigating?). 3. Describe in detail exactly how you conducted this method (The HOW). Someone reading it needs to be able to follow your instructions. Which equipment did you use? 4. Describe your sampling method (Refer to random or systematic sampling). D) Risk Assessment. For TWO risks: 1. Outline the risk to health and safety associated with primary data collection 2. Explain how you attempted to minimise the risk. E) Presentation techniques 1. Use at least ONE graphical technique to present your data e.g. annotated photographs, cross-sections, line graph, bar graph, histograms, scatter-graphs, line graphs, 2. Use at least ONE cartographic technique to present your data e.g. annotated maps, proportional circles, proportional divided circles, proportional line graphs, flow lines, desire lines, trip lines, isolines. 3. Justify the use of ONE graphical technique and ONE cartographic technique. F) Analysis 1. Use ONE statistical technique to analyse your data e.g. central tendency (mean, median, mode) OR dispersion (median and interquartile range), (mean and standard deviation) OR correlation (spearman’s rank). 2. Use ONE graphical technique to analyse your data e.g. histogram, scattergraph. 3. Justify the use of ONE statistical and ONE graphical analytical technique. @GeoWilmington AS Geography G) Conclusion and Further Research 1. Referring to your results, outline the main conclusions of your enquiry. 2. How far did your fieldwork conclusions match the geographical idea on which your investigation was based? 3. Explain how your enquiry improved your understanding of the topic 4. Suggest further areas of research. H) Evaluation. For ONE primary data collection method and ONE secondary data collection method: 1. Discuss the strengths of the method. Did the method help you answer the key question? 2. Discuss the weaknesses/limitations of the method. Explain how weakness with your method could compromise the accuracy of your results and weaken the validity of your conclusions. 3. Suggest an improvement to the method. Explain how this improvement would make your results more accurate and your conclusions more valid. Reculver Feedback Grid Grade U A. B. C. D. E. F. G. H. Introduction/Theory/Purpose Study Area/Location Data collection methods Risk Assessment Presentation Techniques Analysis Conclusion & Further Research Evaluation FINAL GRADE Overall comment: WWW EBI E D C B A @GeoWilmington AS Geography
