TWA/42
advertisement
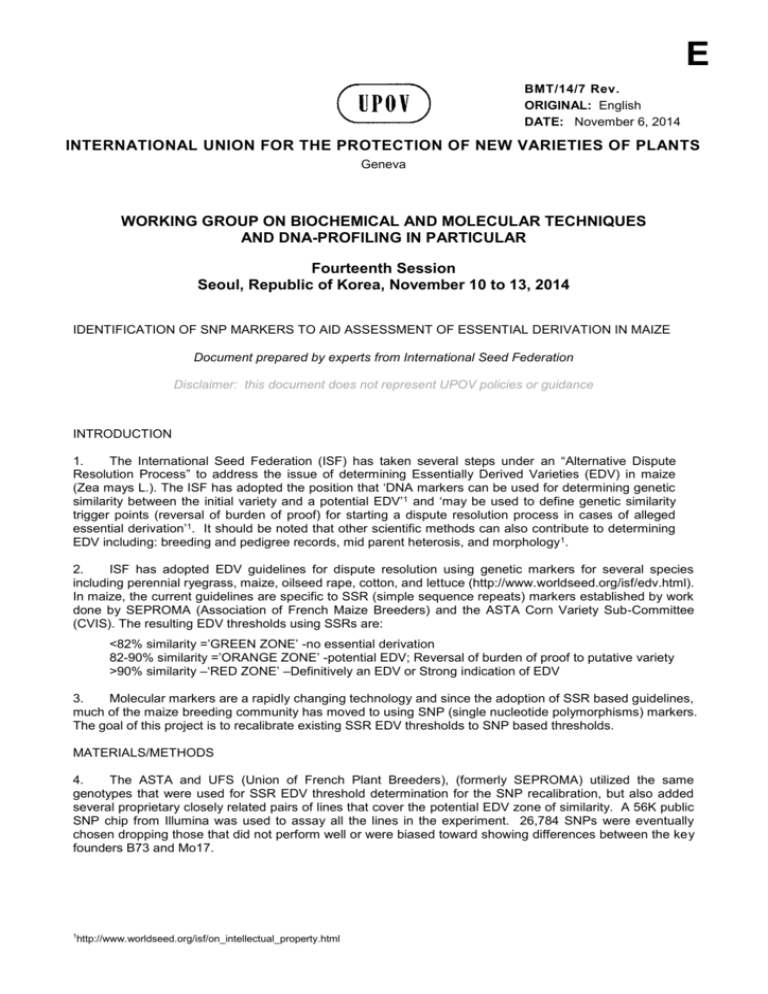
E BMT/14/7 Rev. ORIGINAL: English DATE: November 6, 2014 INTERNATIONAL UNION FOR THE PROTECTION OF NEW VARIETIES OF PLANTS Geneva WORKING GROUP ON BIOCHEMICAL AND MOLECULAR TECHNIQUES AND DNA-PROFILING IN PARTICULAR Fourteenth Session Seoul, Republic of Korea, November 10 to 13, 2014 IDENTIFICATION OF SNP MARKERS TO AID ASSESSMENT OF ESSENTIAL DERIVATION IN MAIZE Document prepared by experts from International Seed Federation Disclaimer: this document does not represent UPOV policies or guidance INTRODUCTION 1. The International Seed Federation (ISF) has taken several steps under an “Alternative Dispute Resolution Process” to address the issue of determining Essentially Derived Varieties (EDV) in maize (Zea mays L.). The ISF has adopted the position that ‘DNA markers can be used for determining genetic similarity between the initial variety and a potential EDV’1 and ‘may be used to define genetic similarity trigger points (reversal of burden of proof) for starting a dispute resolution process in cases of alleged essential derivation’1. It should be noted that other scientific methods can also contribute to determining EDV including: breeding and pedigree records, mid parent heterosis, and morphology1. 2. ISF has adopted EDV guidelines for dispute resolution using genetic markers for several species including perennial ryegrass, maize, oilseed rape, cotton, and lettuce (http://www.worldseed.org/isf/edv.html). In maize, the current guidelines are specific to SSR (simple sequence repeats) markers established by work done by SEPROMA (Association of French Maize Breeders) and the ASTA Corn Variety Sub-Committee (CVIS). The resulting EDV thresholds using SSRs are: <82% similarity =’GREEN ZONE’ -no essential derivation 82-90% similarity =’ORANGE ZONE’ -potential EDV; Reversal of burden of proof to putative variety >90% similarity –‘RED ZONE’ –Definitively an EDV or Strong indication of EDV 3. Molecular markers are a rapidly changing technology and since the adoption of SSR based guidelines, much of the maize breeding community has moved to using SNP (single nucleotide polymorphisms) markers. The goal of this project is to recalibrate existing SSR EDV thresholds to SNP based thresholds. MATERIALS/METHODS 4. The ASTA and UFS (Union of French Plant Breeders), (formerly SEPROMA) utilized the same genotypes that were used for SSR EDV threshold determination for the SNP recalibration, but also added several proprietary closely related pairs of lines that cover the potential EDV zone of similarity. A 56K public SNP chip from Illumina was used to assay all the lines in the experiment. 26,784 SNPs were eventually chosen dropping those that did not perform well or were biased toward showing differences between the key founders B73 and Mo17. 1 http://www.worldseed.org/isf/on_intellectual_property.html BMT/14/7 Rev. page 2 GOALS AND APPROACH • • • • Determine number of markers needed Give good genome and physical map coverage Compare genetics similarities using the SNP and SSR data Convert SSR threshold zones to SNP equivalents via correlation NUMBER OF MARKERS NEEDED 5. Correlations among SNP subsets and the 26,874 were very high (0.95), (Table 1). Standard deviations where also very low compared to the SSR 163 set with values less than half that of SSRs. MAP COVERAGE 6. An algorithm was used to select SNPs for optimum genomic and physical map coverage (Figure 1). 1536 SNPs were chosen using each map coverage approach yielding a final total of 3072 markers, which fits with current Illumina technology. The 3072 SNP set resulted in very low standard deviation (0.004) and very high (0.99) correlation values with the starting set of 26,874 SNPs. COMPARING GENETIC SIMILARITIES BETWEEN SNPS AND SSRS 7. Genetic similarity was computed using Roger’s Distance for both the 3072 SNP set and 163 SSR sets, then converted to similarity via (1-Roger’s Distance). Pairwise distances were highly correlated (Figure 2). CONVERTING SSR THRESHOLDS TO SNP EQUIVALENTS 8. The regression equation was then used to recalibrate the SSR thresholds to SNP thresholds. The new thresholds are: <91% similar =’GREEN ZONE’ -no essential derivation ≥91-<95% similar =’ORANGE ZONE’ -potential EDV; reversal of burden of proof to putative variety ≥95% similar =’RED ZONE’ -strong indication of EDV CONCLUSION 9. The joint ASTA and UFS project successfully demonstrated the utility of SNPs in EDV determination. Subsets of SNP correlated very well with each other and a robust set of 3072 SNP markers were selected and established as the core set for use in genetic distance calculations. The set has been published on the ISF website (http://www.worldseed.org/isf/edv.html) and EDV determination via SNPs adopted at the ISF congress in Beijing, 2014. Table 1. The standard deviations between various SNP subsets to the starting SNP set of 26,874 markers. For reference the standard deviation of the 163 SSR set is also shown. Marker Set SD Mean correlation with 26,874 SNPs 3072 SNPs 0.004 0.99 1536 SNPs 0.006 0.98 768 SNPs 0.008 0.98 384 SNPs 0.012 0.95 163 UFS SSRs 0.031 BMT/14/7 Rev. page 3 Genetic Map Physical Map Figure 1. Map coverage of 1536 SNPs selected for physical map coverage and the second 1536 SNPs selected for genetic map coverage comprising the 3072 SNPs selected. 10. The Annex to this document contains a copy of a presentation “Identification of SNP Markers to Aid Assessment of Essential Derivation in Maize” to be made at its fourteenth session of the Working Group on Biochemical and Molecular Techniques and DNS-Profiling in particular (BMT). Yves Rousselle, Liz Jones, Stephen Smith & Barry Nelson et al. International Seed Federation [Annex follows] BMT/14/7 Rev. ANNEX 1 http://www.worldseed.org/isf/on_intellectual_property.html BMT/14/7 Rev. Annex, page 2 BMT/14/7 Rev. Annex, page 3 BMT/14/7 Rev. Annex, page 4 BMT/14/7 Rev. Annex, page 5 BMT/14/7 Rev. Annex, page 6 [End of Annex and of document]


