here
advertisement
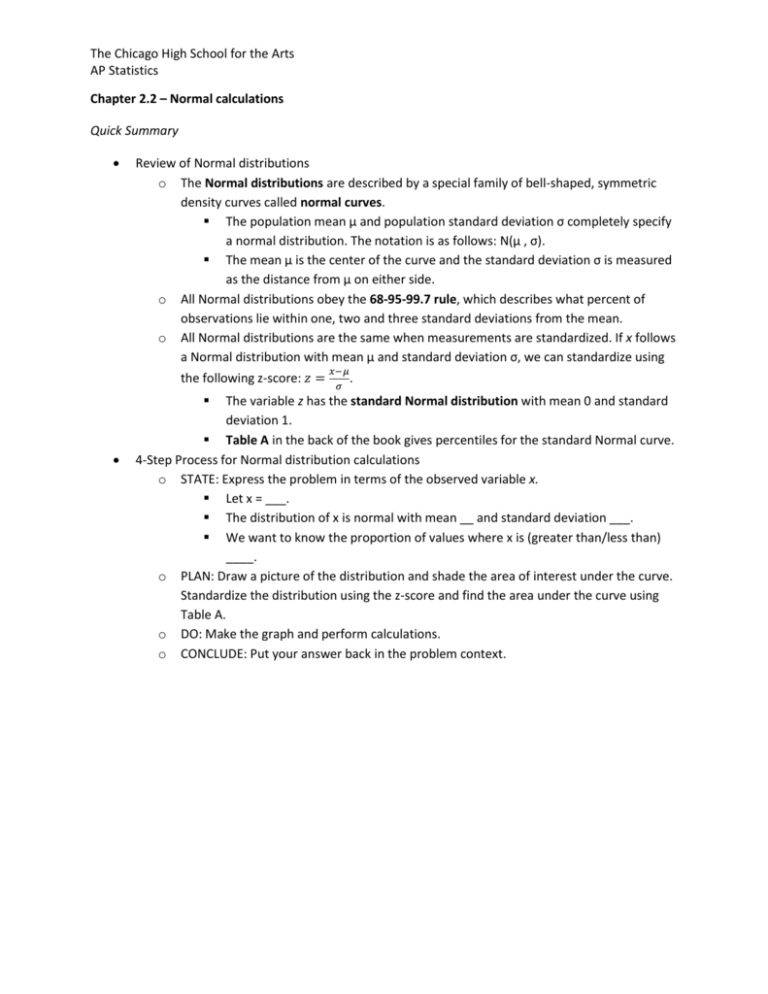
The Chicago High School for the Arts AP Statistics Chapter 2.2 – Normal calculations Quick Summary Review of Normal distributions o The Normal distributions are described by a special family of bell-shaped, symmetric density curves called normal curves. The population mean μ and population standard deviation σ completely specify a normal distribution. The notation is as follows: N(μ , σ). The mean μ is the center of the curve and the standard deviation σ is measured as the distance from μ on either side. o All Normal distributions obey the 68-95-99.7 rule, which describes what percent of observations lie within one, two and three standard deviations from the mean. o All Normal distributions are the same when measurements are standardized. If x follows a Normal distribution with mean μ and standard deviation σ, we can standardize using the following z-score: 𝑧 = 𝑥−𝜇 . 𝜎 The variable z has the standard Normal distribution with mean 0 and standard deviation 1. Table A in the back of the book gives percentiles for the standard Normal curve. 4-Step Process for Normal distribution calculations o STATE: Express the problem in terms of the observed variable x. Let x = ___. The distribution of x is normal with mean __ and standard deviation ___. We want to know the proportion of values where x is (greater than/less than) ____. o PLAN: Draw a picture of the distribution and shade the area of interest under the curve. Standardize the distribution using the z-score and find the area under the curve using Table A. o DO: Make the graph and perform calculations. o CONCLUDE: Put your answer back in the problem context.
