Sec 8 - Monitoring Apr 30
advertisement
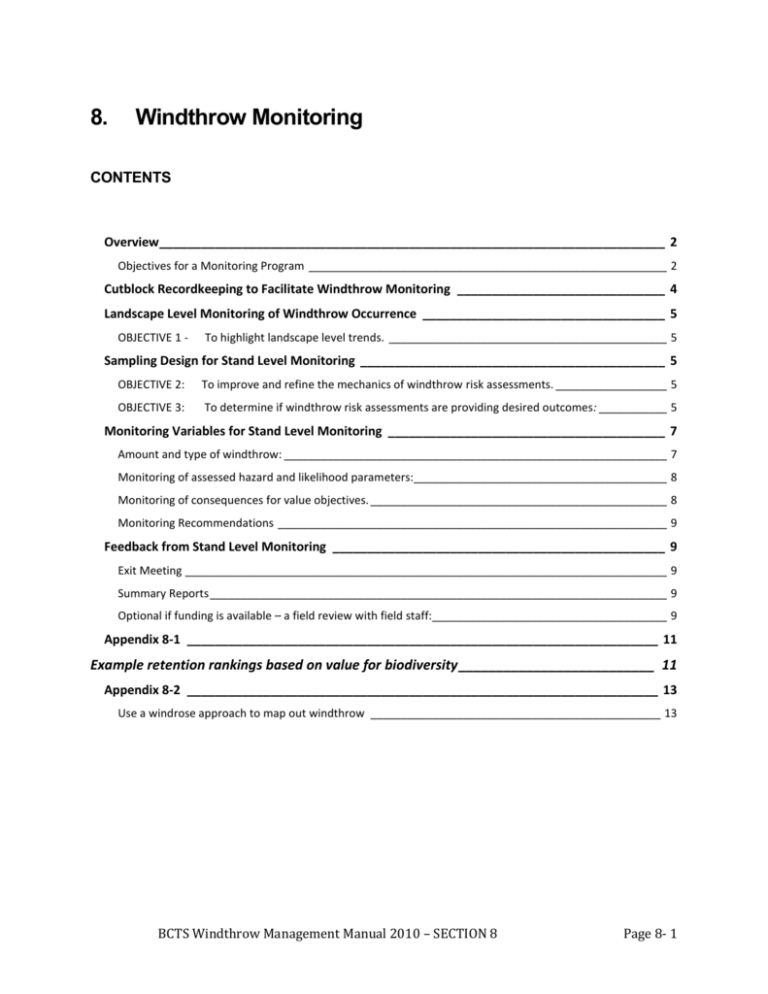
8. Windthrow Monitoring CONTENTS Overview_________________________________________________________________________ 2 Objectives for a Monitoring Program __________________________________________________________ 2 Cutblock Recordkeeping to Facilitate Windthrow Monitoring ______________________________ 4 Landscape Level Monitoring of Windthrow Occurrence ___________________________________ 5 OBJECTIVE 1 - To highlight landscape level trends. _____________________________________________ 5 Sampling Design for Stand Level Monitoring ____________________________________________ 5 OBJECTIVE 2: To improve and refine the mechanics of windthrow risk assessments. __________________ 5 OBJECTIVE 3: To determine if windthrow risk assessments are providing desired outcomes: ___________ 5 Monitoring Variables for Stand Level Monitoring ________________________________________ 7 Amount and type of windthrow: ______________________________________________________________ 7 Monitoring of assessed hazard and likelihood parameters:_________________________________________ 8 Monitoring of consequences for value objectives. ________________________________________________ 8 Monitoring Recommendations _______________________________________________________________ 9 Feedback from Stand Level Monitoring ________________________________________________ 9 Exit Meeting ______________________________________________________________________________ 9 Summary Reports __________________________________________________________________________ 9 Optional if funding is available – a field review with field staff:______________________________________ 9 Appendix 8-1 ____________________________________________________________________ 11 Example retention rankings based on value for biodiversity __________________________ 11 Appendix 8-2 ____________________________________________________________________ 13 Use a windrose approach to map out windthrow _______________________________________________ 13 BCTS Windthrow Management Manual 2010 – SECTION 8 Page 8- 1 Overview Goals and Objectives for a Monitoring Program The general goal of a windthrow monitoring program is: To learn from past windthrow management activities to facilitate continuous improvement over time. To achieve this goal, windthrow monitoring includes a number of potential objectives: 1. To support localized landscape level probability mapping by tracking the significant occurrence of windthrow in the operating area over time to highlight potential problem areas, susceptible stand types and prevailing directions of damaging winds to aid in development planning. 2. To determine if the assessment of windthrow risk1 and subsequent linkage to layout design and prescription development is providing the desired outcomes. 3. To improve and refine the mechanics of windthrow risk assessment, which will ultimately improve outcomes. 4. To better understand the success of windfirming and other measures to limit windthrow. 1. To highlight landscape level trends to complement probability mapping: Building on the broad landscape level insights from the Business Area probability maps to map windthrow occurrence over time will help facilitate improved approaches to silvicultural system and block location, orientation and sequencing across landscapes. The probability mapping may initially help to identify landscapes where windthrow is perceived as an overwhelming challenge for layout and prescriptions. Mapping windthrow and salvage locations over time along with the orientation of the damage helps identify locally windthrow prone areas/features and dominant wind directions. This added information will help to design broad strategies for harvesting, silvicultural systems, retention and reserves over time. While probability mapping will be useful to start development of these strategies, not all of the business areas have such mapping. Also, landscape monitoring of windthrow occurrence will gauge the success of such broad approaches and may provide insights to refine them. 2. To improve and refine field windthrow risk assessments It is important to use monitoring over time to continually improve the application of the windthrow risk assessment and the associated skills of layout and prescription staff. If these mechanics are improved so that windthrow risk and all the associated hazards and thresholds are better estimated, then future impacts on value objectives may be avoided. It is therefore desirable to improve the skills and judgments of assessors before impacts on values occur. Reference to “windthrow risk assessment” is intended to include the full package of measurements, assessments, estimates and predictions to determine biophysical hazard for windthrow, likelihood of windthrow and ultimately, windthrow risk. 1 BCTS Windthrow Management Manual 2010 – SECTION 8 Page 8- 2 Primarily, this monitoring objective is achieved by validation or refinement of predicted estimates of windthrow likelihood and associated thresholds (penetration and amounts) in specific stands, landscape settings, and layout configurations. Such monitoring should be conducted over a range of situations and circumstances, and should therefore likely not be limited to those with concerns about impacts on value objectives. At times, monitoring may be focused mostly on improvement of assessments, because few situations are being encountered where value objectives appear compromised. Regardless, monitoring should always include a review of the estimated consequences and thresholds, which may have been over-estimated for the particular situations encountered, incurring unnecessary costs in staff time, treatments or reserved timber. Such monitoring requires significant expertise and experience with windthrow hazard and risk assessment and management. 3. To determine if windthrow risk assessments are providing desired outcomes: First it is important to determine if desired outcomes are being attained by exploring the impacts on key values and associated objectives in spite of windthrow assessment and management efforts. Where it is clear that desired outcomes are not being attained, the monitoring will initiate an exploration of the questions associated with the problem(s). This may be a relatively simple or considerably complex investigation. The range of questions that may be associated with windthrow-compromised value objectives include: a. Was the initial assessment of biophysical hazard and likelihood correct? b. How close was the estimate of windthrow penetration and amount to that which actually occurred? Were larger than expected trees, or different species damaged by wind? c. Was the prescription followed, or windfirming treatments correctly applied? d. Were the consequences of windthrow under, or over estimated, and/or threshold values set exceedingly high? e. Related – Are the consequences of windthrow understood well enough to set reasonable thresholds for windthrow? If there is little or no impact on management values, there may appear to be little need to follow up on the questions listed above. However, this conclusion is misleading. Compromised values due to windthrow2 may only be obvious occasionally – especially where consequences are being over-estimated and thresholds set exceedingly high. Yet, monitoring is still worthwhile. A related continuous improvement question that may be worth spending time on is whether or not the consequences of windthrow are understood well enough to enable assessors to adequately set thresholds for windthrow. For values that frequently emerge across a landscape, this question may be worthwhile pursuing with the appropriate specialist(s). For example - coarse filter conservation objectives using retention to provide for structural diversity is particularly challenging for establishment of windthrow thresholds. A focus on windthrow at a small scale may be misleading. First, at the stand level, it may be more important to collect information on the trees left standing to determine impact (Appendix 8- 2 expressed as actual windthrow found in monitoring exceeding preharvest threshold values (for penetration and amount). BCTS Windthrow Management Manual 2010 – SECTION 8 Page 8- 3 1). However stand level impacts should be put into context with higher scales of coarse filter management before being judged as a “potential impact” or “trend of concern”. Therefore, it may be useful to have some specialists involved in helping to provide some guidance for establishing stand level thresholds for windthrow over time, and for long-term monitoring of trends. 4. To better understand the success of windfirming and other measures. Windfirming treatments can be costly. It is therefore useful when monitoring to specifically evaluate results of such treatments, interpret effectiveness and make recommendations. It is useful to identify treatments that provide unacceptable results, evaluate the failure and provide recommendations. However it may be challenging without a well-chosen untreated control area to link success to the treatment. Windfirming conducted where it is not required may have the appearance of a successful treatment. Therefore, it is important that monitoring include considerable expertise and experience. This will provide the most useful interpretations and recommendations to effectively improve windfirming over time. Summary Monitoring is an essential component for continuous improvement. It requires a well thought out procedure clearly tied to objectives for management, allowing for feedback to those who were responsible for the original prescriptions and implementation. As can be seen from the identified objectives above, it is not only windthrow, the amount or type that is of interest, it is often whether the amount of windthrow was limited adequately so the objectives for identified values were not compromised. A determination of a compromised objective will vary by situation and could require input from a range of specialists. Clearly, monitoring may require assessment of more than simply trees on the ground. Therefore a number of suggestions are provided to address the above objectives – beginning with recordkeeping. Cutblock Recordkeeping to Facilitate Windthrow Monitoring 1. At the cutting permit stage, highlight key windthrow assessment information in the corporate database, including: a. Maximum (highest) consequences ranking on the block. b. Maximum biophysical hazard for the block. c. Maximum windthrow likelihood ranking on the block. d. Maximum windthrow risk on the block. Note: The intent is to be able to characterize the block as a whole with four metrics related to windthrow hazard and risk. 2. Store results of field windthrow risk assessments for all edge/strata within each cutblock where it can easily be accessed over time. BCTS Windthrow Management Manual 2010 – SECTION 8 Page 8- 4 Landscape Level Monitoring of Windthrow Occurrence OBJECTIVE 1 - To highlight landscape level trends. This objective for monitoring at the landscape level will support and augment the UBC probability mapping by providing more detailed information to planners within geographic units. Suggested steps to address this objective: Because this objective is focused on the landscape scale, it can mostly be satisfied using an office based tracking of cutblocks over time, greatly facilitated where aerial photography is continuously updated. While this information will be useful to address objective 1, it will also be used to help address objectives 2 and 3. 1. Track significant windthrow on all harvested cutblocks over time. The detection of windthrow is best incorporated in standard operating procedures associated with post harvesting activities at least 2-3 winter storm seasons post-harvest. This may be achieved from several sources: a. Photographs and field notes taken by staff conducting other post-harvest fieldwork in the cutblock. b. Satellite or ortho-photo imagery that was taken at least two years since the completion of harvest. c. Visual observations and photographs taken when flying over, or driving through a cutblock. Annual scheduled flyovers may be necessary where windthrow could not be recorded by other means. NOTE: As a minimum such information needs to be geo-referenced (with a GPS unit if necessary). As well a compass bearing should be noted to orient the photographic image. 2. This information should be entered into the corporate database for each block. As well, the location of windthrow should be recorded on a GIS overlay and clearly identified as an edge segment or dispersed retention stratum. Images of the windthrow need to be organized and stored with other cutblock information for ease of future reference. Sampling Design for Stand Level Monitoring OBJECTIVE 2: To improve and refine the mechanics of windthrow risk assessments. OBJECTIVE 3: To determine if windthrow risk assessments are providing desired outcomes: Suggested steps to address these objectives: This monitoring will be field-based, including observations and measurements to validate initial assessment rankings and thresholds. It should likely be conducted every 2-3 years initially to ensure learning and improvement occurs. Gradually over time this may be extended to every 6 years or more, depending on the significance of windthrow in the Operational Unit and the general experience and knowledge of the staff. In areas with a high BCTS Windthrow Management Manual 2010 – SECTION 8 Page 8- 5 staff turnover and highly significant windthrow, monitoring may need to continue at relatively frequent intervals. 1. The sampling population: Assumptions – Because the general goal is to maximize learning from past windthrow management activities, it is most useful to focus on cutblocks where management of windthrow was, or may be relevant. Relevance can be detected by assessed consequences and/or detected occurrence of windthrow since harvest. Use the following rules to identify the population of cutblocks which are relevant for windthrow monitoring: a. Identify all cutblocks in the corporate database that have experienced at least 2 winters of storms. b. From the cublocks identified in (a), list all blocks with both: i. Significant windthrow since harvest (see objective 1 above), and ii. At least one windthrow assessment with a maximum consequences ranking of moderate or higher. This will help isolate most, but not all blocks where value objectives may have been compromised. c. Add to the list all other blocks having a maximum preharvest windthrow consequence ranking of high or very high. This will capture blocks with highly susceptible values but no significant windthrow noted since harvest. For these blocks it is possible that undetected levels of windthrow may have caused undetected consequences. 2. Sample Size Assumptions: A large enough sample should be included to cover the range of windthrow management situations encountered in the operational unit so that conclusions regarding trends may be drawn with a reasonable amount of confidence. In Operational Units where windthrow is a significant concern over the entire Unit, consider sampling a minimum of 15-20% of the cutblocks harvested 2-3 years ago ((minimum 20 blocks). In operational units where windthrow is not a significant concern, a lower level of monitoring should be considered. 3. Choosing the sample cutblocks: Use the following screening rules to construct the sample from the sample population: a. Choose all blocks with a maximum consequence ranking of very high or high. b. Unless the minimum sample size has already been exceeded, use a random number generator to randomly pick cutblocks with a moderate maximum consequence ranking until the minimum sample size is reached. BCTS Windthrow Management Manual 2010 – SECTION 8 Page 8- 6 4. Planning the edges/strata to examine within sample cutblocks: Assumption – We are interested in a range of assessed conditions for windthrow, especially where windthrow has actually occurred. It is useful however to check the assessment in areas of concern with little windthrow to ensure windthrow and impacts are not being over-estimated. Where windthrow is not assessed (assume consequences and/or treatment risk were determined to be low) it is only worthwhile to monitor if significant windthrow has occurred - to ensure that assessment of consequences was correct. Use the following rules to plan monitoring activities on the cutblocks: a. Examine all edges/strata with a high to very high consequence rating regardless of the amount of windthrow noted since harvesting. b. Examine all edges with some form of crown modification. c. Examine all other edges/strata showing significant windthrow (either at the time of monitoring, or recorded previously) regardless of consequence ranking (if any3). d. Examine more edges/dispersed strata if necessary to a total of 20, for the moderate consequence ranking. Use a random number generator to randomly choose them across the sample cutblocks. e. Examine more edges/dispersed strata if necessary to a total of 10, for the low consequence category. Use a random number generator to randomly choose them across the sample cutblocks. Monitoring Variables for Stand Level Monitoring Examinations on individual edges/strata will require measurements, knowledgeable estimates, interpretations, and recommendations. While measurements may be relatively simple, considerable expertise, judgment and experience will be required for quality feedback. It will therefore be necessary to use assessment teams with considerable experience and expertise in windthrow assessments. Amount and type of windthrow: 1. Compare actual windthrow to that predicted in the preharvest assessment. It will be necessary to first gather pertinent information from the BCTS preharvest windthrow risk assessment field forms 2 and 3. It may also be necessary to review other pertinent information such as higher level plans, assessments by qualified professionals, and other information pertinent to the block. 3 Some edges or dispersed retention strata may not have had a windthrow assessment if the assessor did not consider it necessary, due to an anticipated low treatment hazard and consequence ranking. BCTS Windthrow Management Manual 2010 – SECTION 8 Page 8- 7 Variable to measure Original estimate or assessed value preharvest Monitored value a. Penetration (max) Predicted Measured to the furthest windthrown rootball. The actual range is also helpful. b. Amount of windthrow in an identified zone Predicted Measured 2. Additional information should be collected to describe the windthrow - estimating the relative range of species, heights, diameters and direction of damaging winds (opposite to the direction of windthrow roots to top). See Appendix 8-2 for an example method to capture wind direction and frequency of blowdown. Monitoring of assessed hazard and likelihood parameters: Problems in predicting the penetration or amount of windthrow may originate with the preharvest predictions. At the monitoring stage, assessors have the benefit of actual outcomes to confirm monitoring estimates. The preharvest assessment of hazards and likelihood should therefore be evaluated and compared against those estimated at the time of monitoring. These hazards and likelihoods include: topographic hazard; stand hazard; soil hazard; biophysical hazard; treatment hazard and windthrow likelihood ranking. Where the monitoring estimates disagree with preharvest predictions, these should be highlighted and discussed with suggested reasons for possible over or under estimates of hazard and likelihood. Monitoring of consequences for value objectives. 1. The following preharvest predictions should be compared to that found when monitoring: Variable to measure Original estimate or assessed value preharvest Monitored value c. Consequence Ranking (record value and associated attributes of concern) Estimated Estimated d. Established Thresholds: Penetration (if applicable): Amount in an identified area (% basal area): Exceeded (yes or no) and by how much? Estimated Also comment on appropriateness of the thresholds (if possible) BCTS Windthrow Management Manual 2010 – SECTION 8 Page 8- 8 2. Examine the area impacted by windthrow, making notes of obvious consequences for established values, and questions for follow-up regarding observed impacts and consequences. Note that in some cases consequence or impact may be relatively obvious, such as windthrow damage to a feature. However, the connection between windthrow damage and consequences is often subtle. While it is useful to know if windthrow is exceeding thresholds set in the preharvest assessment based on consequences, it is also useful to examine if the thresholds were appropriate given the consequences. It may not be possible to address this question at the windthrow monitoring phase where impacts on values or consequences are not obvious or easily measured. Instead it may be necessary at this point to recommend that specialists become involved to help determine impacts. A rating system, such as the example provided in Appendix 8-1 could be developed by specialists prior to the monitoring to help assess consequences where some common values of interest are likely to be encountered often. It may be useful to engage these specialists to help initially provide guidance for thresholds set in preharvest assessments. Monitoring Recommendations Lastly, for every edge/stratum examined, recommendations should be designed regarding what should have been done differently, including improvements to: general assessment procedures, establishment of thresholds; layout and prescribed treatments. Feedback from Stand Level Monitoring Exit Meeting After monitoring in an operating unit, an exit meeting should be held for all layout personnel for the operating area. If possible this should be a one day indoor session where data are presented by block showing the results of the windthrow assessment and resultant windthrow and impacts on the identified values. PowerPoint slides by cutblock can be used with a similar format to present the information and provide discussion and learning points. These would also include recommendations of what should have been done differently where relevant. Summary Reports Provide a report for each Operational Unit that summarizes the windthrow monitoring findings based on the findings on each cutblock. The report should summarize key data, as well as interpretations to provide a complete picture of the quality of preharvest assessments, outcomes of assessments and associated layout and prescriptions, and unexpected consequences. Recommendations for improvement should be summarized as well. Optional if funding is available – a field review with field staff: Priorize blocks to visit to highlight: BCTS Windthrow Management Manual 2010 – SECTION 8 Page 8- 9 1. Successes – layout that worked, windthrow was kept below identified thresholds and the integrity of the objectives is maintained (consequences avoided, regret minimized). 2. Issue blocks – windthrow compromised the objectives, consequences were not avoided, what went wrong? What could have been done differently? 3. For a one day field trip, 3 to 5 sites can be visited depending upon logistics. BCTS Windthrow Management Manual 2010 – SECTION 8 Page 8- 10 Appendix 8-1 Example retention rankings based on value for biodiversity4 For each Group or Segment - start with the initial rankings add points according to conditions up to a max total of 5. Final group rankings will range from Excellent (5), to Good (4-4.5), to Acceptable (3-3.5), to Poor (1.5-2.5) to Unacceptable (0-1). IF - There is no standing retention (i.e., the entire patch was blown down) – (0) IF - Standing retention is dominated (most of basal area) by small 0 – 25 cm dbh trees with low vigor. (1 point to start) a) If retention has moderate to high vigor – add 1 point b) If windthrow is > or equal to 50% (basal area) - subtract ½ pt c) If there are scattered dead snags (40 cm+) trees with a significant presence - Add ½ point d) If retention is anchored on a riparian feature, a rocky outcrop with unique vegetation, a special habitat (bear den, nesting habitat etc), or any other uncommon biological feature - Add 1 point e) If an intact understory is present, complete with intact forest floor, herbs and shrubs and/or understory trees - Add ½ point. f) If patch size was designed as > 0.30 ha – Add ½ pt (Unless the shape is long and narrow perpendicular to the wind) g) If patch size was designed as < 0.20 ha or as a long narrow strip – Subtract ½ pt 4 This is provided as an example; specific approaches to address local objectives may vary and require a different assessment procedure. Specialist input is recommended. BCTS Windthrow Management Manual 2010 – SECTION 8 Page 8- 11 IF – Standing Retention is dominated (most of the basal area) by trees ≥25 cm. (2.5 points to start) h) If most trees have low vigor - Subtract 1 point i) If windthrow is > or equal to 50% (basal area) - subtract 1 pt. j) If BA is dominated by trees 35 –55 cm dbh - Add ½ point k) If BA is dominated by trees 55-75 dbh class - Add 1 point l) If BA is dominated by trees 80 cm+ dbh class - Add 1 ½ points (If one or more of these trees are > 150 cm dbh – add an additional ½ point) m) If very large (80 cm+) trees do not dominate but are scattered with a significant presence - Add ½ point. n) If 50%+ of the live trees (by basal area) have old growth features – dead top / limbs, some rot, lichen on branches etc Add ½ point o) If there are scattered dead snags (40 cm+) trees with a significant presence - Add ½ point p) If retention is anchored on a riparian feature, a rocky outcrop with unique vegetation, a special habitat (bear den, nesting habitat etc), or any other uncommon biological feature - Add 1 point q) If an intact understory is present, complete with intact forest floor, herbs and shrubs and/or understory trees - Add ½ point. r) If patch size was designed as > 0.30 ha – Add ½ pt (Unless the shape is long and narrow perpendicular to the wind) s) If patch size was designed as < 0.20 ha or as a long narrow strip – Subtract ½ pt BCTS Windthrow Management Manual 2010 – SECTION 8 Page 8- 12 Appendix 8-2 Use a windrose approach to map out windthrow Methods (procedure to create chart in Excel) Record direction of fall (i.e. direction of damaging wind) for sample of trees Establish damage direction classes Record frequency in each class Calculate proportion of damage in each class Insert radar chart Select Class Midpoint for axis labels and Frequency or Proportion for series Example: BCTS Windthrow Management Manual 2010 – SECTION 8 Page 8- 13 Advantages/Disadvantages Advantage(s): acquire highly localized data on damaging wind directions and is a good system to record the types of trees being damaged Disadvantage(s): Any estimates of wind velocities which caused damage are imprecise, damage may have occurred from more than one windthrow event. BCTS Windthrow Management Manual 2010 – SECTION 8 Page 8- 14
