7.1 Theoretical and Experimental Probabilities
advertisement
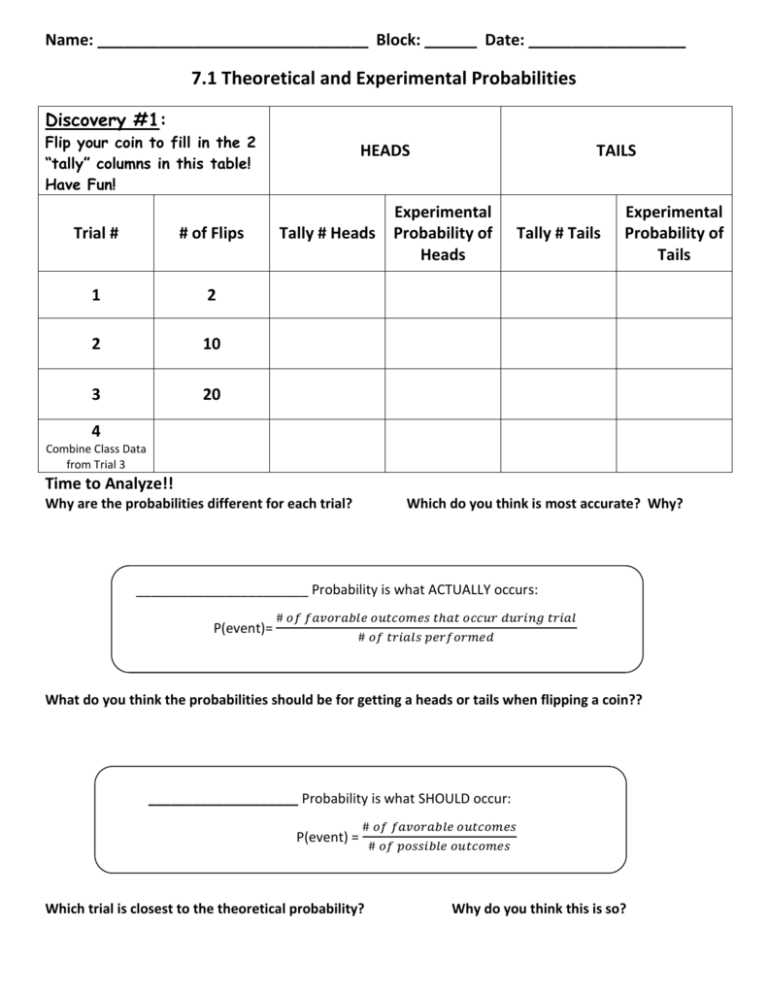
Name: _______________________________ Block: ______ Date: __________________ 7.1 Theoretical and Experimental Probabilities Discovery #1: Flip your coin to fill in the 2 “tally” columns in this table! Have Fun! Trial # # of Flips 1 2 2 10 3 20 HEADS Tally # Heads TAILS Experimental Probability of Heads Tally # Tails Experimental Probability of Tails 4 Combine Class Data from Trial 3 Time to Analyze!! Why are the probabilities different for each trial? Which do you think is most accurate? Why? _______________________ Probability is what ACTUALLY occurs: P(event)= # 𝑜𝑓 𝑓𝑎𝑣𝑜𝑟𝑎𝑏𝑙𝑒 𝑜𝑢𝑡𝑐𝑜𝑚𝑒𝑠 𝑡ℎ𝑎𝑡 𝑜𝑐𝑐𝑢𝑟 𝑑𝑢𝑟𝑖𝑛𝑔 𝑡𝑟𝑖𝑎𝑙 # 𝑜𝑓 𝑡𝑟𝑖𝑎𝑙𝑠 𝑝𝑒𝑟𝑓𝑜𝑟𝑚𝑒𝑑 What do you think the probabilities should be for getting a heads or tails when flipping a coin?? ____________________ Probability is what SHOULD occur: P(event) = # 𝑜𝑓 𝑓𝑎𝑣𝑜𝑟𝑎𝑏𝑙𝑒 𝑜𝑢𝑡𝑐𝑜𝑚𝑒𝑠 Which trial is closest to the theoretical probability? # 𝑜𝑓 𝑝𝑜𝑠𝑠𝑖𝑏𝑙𝑒 𝑜𝑢𝑡𝑐𝑜𝑚𝑒𝑠 Why do you think this is so? Situation #2: The graph shows the result of an experiment in which two number cubes were rolled. According to the experimental probability, is the sum of 12 likely to occur? Only ____ out of ____ sums = 12. P(12) = According to the experiment, which sum is most likely to occur? ________ What is the theoretical probability to get the sum of 12? P(12) = _______ = ____ What is the theoretical probability to get a sum of 7? P(7) = _______ = ____ How does this theoretical compare to the results found in the experiment? Situation #3: The table shows the results of spinning the equally divided 8 section spinner. Compare the theoretical and experimental probabilities of the spinner landing on 6. Theoretical: P = ________ Experimental: P = _________ Compare: ________________ Based on experimental probability, how many times would you expect the spinner to land on 3 if the spinner is spun 200 times? Hint--Use a Proportion: Name: ______________________________ Block: ____ Date: _____________________________ WKS 7.1—Experimental and Theoretical Probability Practice 1. In a survey, 120 out of 200 students said their favorite food was pizza. What is the experimental probability that a student chose pizza as his or her favorite food? Use the table that shows the results of rolling a number cube 50 times. 2. a) Based on the results, what is the probability of getting a five? __________ b) Based on the results, how many fives would you expect to occur in 300 rolls? Result # of times 1 6 2 10 3 8 4 7 5 10 6 9 c) What is the theoretical probability of getting a five? ___________ d) Based on the theoretical probability, how many fives would you expect to occur in 300 rolls? e) Compare the theoretical probability to the experimental probability. _________________ 3. Use the results of a survey of 200 people shown at the right. The survey determined the person’s first pet. a) What is the probability that a person says his or her first pet was a cat? b) Out of 500 people, how many would you expect to say a cat was his or her first pet? First pet Number bird 32 cat 56 dog 66 rabbit 19 other 27 c) What is the probability that a person says his or her first pet was a bird? d) Out of 500 people, how many would you expect to say a bird was their first pet? 4. At figure skating practice, Michelle successfully landed 15 out of 18 attempts at a double axel. What is the experimental probability that she will successfully land a double axel? Color Result Red 12 Blue 9 Green 17 Yellow 22 5. The table displays the results of spinning the spinner 60 times. a. Based on the results, what is the probability of spinning a yellow? b. Based on the results, how many times would you expect to spin yellow in 300 spins? c. Did you use theoretical or experimental probability in questions a and b? d. What is the theoretical probability of spinning yellow? _________ e. Based on the theoretical probability, how many times would you expect to spin yellow in 300 spins? 6. Roseanna recorded the results in the table shown using a spinner with 8 equal-sized sections. Each section is labeled with either “Win 1” or “Win 2” or “Win 3”. How many of the sections do you predict are labeled “Win 1”? Result No. of times A) 1 B) 3 C) 5 D) 7 Win 1 Win 2 Win 3 7. What is the theoretical probability of picking a red card out of a standard deck of cards? (Hint: there are 52 total cards in a standard deck of cards) 8. What is the theoretical probability that you will randomly choose a day of the week that starts with “T”? 9. What is the theoretical probability that you will choose a “KING” card from a standard deck of cards? (Hint: there are four Kings in a deck) 24 11 5
