Supplementary Tables
advertisement
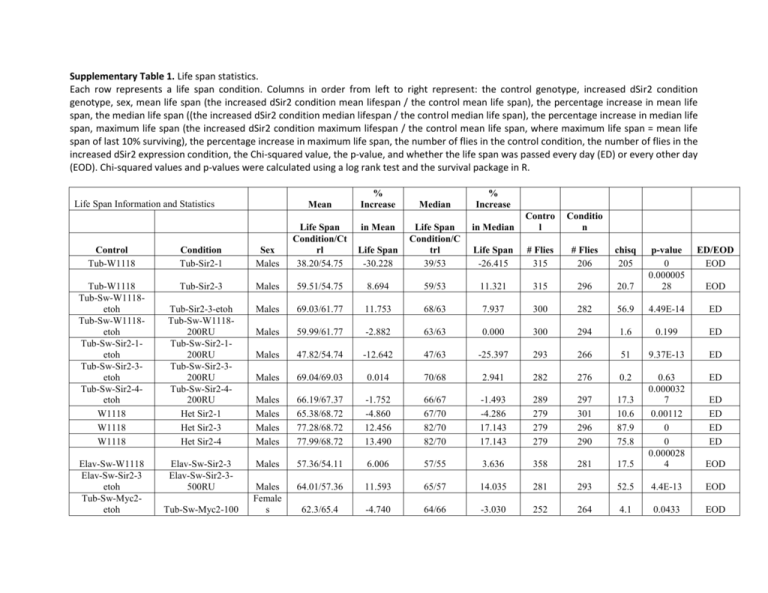
Supplementary Table 1. Life span statistics. Each row represents a life span condition. Columns in order from left to right represent: the control genotype, increased dSir2 condition genotype, sex, mean life span (the increased dSir2 condition mean lifespan / the control mean life span), the percentage increase in mean life span, the median life span ((the increased dSir2 condition median lifespan / the control median life span), the percentage increase in median life span, maximum life span (the increased dSir2 condition maximum lifespan / the control mean life span, where maximum life span = mean life span of last 10% surviving), the percentage increase in maximum life span, the number of flies in the control condition, the number of flies in the increased dSir2 expression condition, the Chi-squared value, the p-value, and whether the life span was passed every day (ED) or every other day (EOD). Chi-squared values and p-values were calculated using a log rank test and the survival package in R. Life Span Information and Statistics Mean % Increase Median % Increase in Median Contro l Conditio n Life Span -30.228 Life Span Condition/C trl 39/53 Life Span -26.415 # Flies 315 # Flies 206 chisq 205 Control Tub-W1118 Condition Tub-Sir2-1 Sex Males Life Span Condition/Ct rl 38.20/54.75 Tub-W1118 Tub-Sw-W1118etoh Tub-Sw-W1118etoh Tub-Sw-Sir2-1etoh Tub-Sw-Sir2-3etoh Tub-Sw-Sir2-4etoh W1118 W1118 W1118 Tub-Sir2-3 Males 59.51/54.75 8.694 59/53 11.321 315 296 Tub-Sir2-3-etoh Tub-Sw-W1118200RU Tub-Sw-Sir2-1200RU Tub-Sw-Sir2-3200RU Tub-Sw-Sir2-4200RU Het Sir2-1 Het Sir2-3 Het Sir2-4 Males 69.03/61.77 11.753 68/63 7.937 300 Males 59.99/61.77 -2.882 63/63 0.000 Males 47.82/54.74 -12.642 47/63 Males 69.04/69.03 0.014 Males Males Males Males 66.19/67.37 65.38/68.72 77.28/68.72 77.99/68.72 Elav-Sw-Sir2-3 Elav-Sw-Sir2-3500RU Males Males Female s Elav-Sw-W1118 Elav-Sw-Sir2-3 etoh Tub-Sw-Myc2etoh Tub-Sw-Myc2-100 in Mean ED/EOD EOD 20.7 p-value 0 0.000005 28 282 56.9 4.49E-14 ED 300 294 1.6 0.199 ED -25.397 293 266 51 9.37E-13 ED 70/68 2.941 282 276 0.2 ED -1.752 -4.860 12.456 13.490 66/67 67/70 82/70 82/70 -1.493 -4.286 17.143 17.143 289 279 279 279 297 301 296 290 17.3 10.6 87.9 75.8 57.36/54.11 6.006 57/55 3.636 358 281 17.5 0.63 0.000032 7 0.00112 0 0 0.000028 4 EOD 64.01/57.36 11.593 65/57 14.035 281 293 52.5 4.4E-13 EOD 62.3/65.4 -4.740 64/66 -3.030 252 264 4.1 0.0433 EOD EOD ED ED ED ED Tub-Sw-Myc2etoh Tub-Sw-Myc2etoh Tub-Sw-Myc9etoh Tub-Sw-Myc9etoh Tub-Sw-Myc9etoh Tub-Sw-Myc2-200 Tub-Sw-Myc2-500 Tub-Sw-Myc9-100 Tub-Sw-Myc9-200 Tub-Sw-Myc9-500 Female s Female s Female s Female s Female s Life Span Information and Statistics (Continued) Control Tub-Sw-Myc2etoh Tub-Sw-Myc2etoh Tub-Sw-Myc2etoh Tub-Sw-Myc9etoh Tub-Sw-Myc9etoh Tub-Sw-Myc9etoh 70.3/65.4 7.492 72/66 9.091 252 245 14.6 0.000134 EOD 73.3/65.4 12.080 78/66 18.182 252 246 52.8 3.78E-13 EOD 68.14/69.14 -1.446 74/76 -2.632 247 238 0.7 0.415 EOD 76.9/69.14 11.224 80/76 5.263 247 233 31.4 2.15E-08 EOD 78.1/69.14 12.959 82/76 7.895 247 251 51.1 8.87E-13 EOD Mean % Increase Median % Increase in Median Contro l Conditio n Life Span # Flies # Flies chisq p-value ED/EO D Condition Sex Life Span Condition/Ct rl Tub-Sw-Myc2-100 Males 60.4/57.36 5.300 64/64 0.000 228 226 0.3 0.606 EOD Tub-Sw-Myc2-200 Males 61.04/57.36 6.416 64/64 0.000 228 252 0.1 0.7 EOD Tub-Sw-Myc2-500 Males 63.88/57.36 11.367 66/64 3.125 228 239 7.5 0.00626 EOD Tub-Sw-Myc9-100 Males 62.60/61.78 1.327 68/64 6.250 245 247 7.7 0.00547 EOD Tub-Sw-Myc9-200 Males 67.57/61.78 9.372 70/64 9.375 245 230 20.3 0.00000657 EOD Tub-Sw-Myc9-500 Males Female s Female s Female s Female 66.06/61.78 6.928 70/64 9.375 245 240 8.7 0.00321 EOD 48.56/62.49 -22.292 49/61 -19.672 349 200 94.3 0 EOD 66.55/62.49 6.497 67/61 9.836 349 289 6.9 0.00881 EOD 78.96/77.53 78.13/77.53 1.844 0.774 80/80 79/80 0.000 -1.250 297 297 282 304 0.1 4.6 0.805 0.0317 ED ED Tub-W1118 Tub-Sir2-1 Tub-W1118 Tub-Sw-W1118etoh Tub-Sw-W1118- Tub-Sir2-3 Tub-Sir2-3-etoh Tub-Sw-W1118- in Mean Life Span Life Span Condition/Ct rl etoh Tub-Sw-Sir2-1etoh Tub-Sw-Sir2-3etoh Tub-Sw-Sir2-4etoh 200RU Tub-Sw-Sir2-1200RU Tub-Sw-Sir2-3200RU Tub-Sw-Sir2-4200RU W1118 Het Sir2-1 W1118 Het Sir2-3 W1118 Het Sir2-4 Elav-Sw-W1118 Elav-Sw-Sir2-3 etoh Elav-Sw-Sir2-3 Elav-Sw-Sir2-3500RU s Female s Female s Female s Female s Female s Female s Female s Female s 61.25/69.55 -11.934 62/71 -12.676 291 271 102 0 ED 82.74/78.96 4.787 85/80 6.250 282 285 48.2 3.76E-12 ED 71.54/70.50 1.475 72/71 1.408 301 301 0.8 ED 70.50/61.53 14.578 75/64 17.188 310 297 28 0.381 0.00000011 9 73.06/61.53 18.739 79/64 23.438 310 298 73.1 0 ED 68.23/61.53 10.889 72/64 12.500 310 310 11 0.000929 ED 68.53/66.37 3.254 69/69 0.000 366 293 4.7 0.0309 EOD 70.74/69.18 2.255 71/69 2.899 293 297 0.3 0.564 EOD Supplementary Table 2. dSir2 mRNA Expression Levels dSir2 expression levels in reported conditions. Each row represents a life span condition. Columns in order from left to right represent: the control genotype, the increased dSir2 expression condition genotype, the dSir2 mRNA level as determined by qPCR, and the p-value as determined by student’s t-test. Control Over expression condition dSir2 mRNA Level p-value Tub-W1118 Tub-Sir2-1 43.21 <0.0001 Tub-W1118 Tub-Sir2-3 11.19 <0.0001 Tub-Sw-W1118-etoh Tub-Sir2-3-etoh 1.30 0.0078 Tub-Sw-Sir2-1-etoh Tub-Sw-Sir2-1-200RU 55.69 <0.0001 Tub-Sw-Sir2-3-etoh Tub-Sw-Sir2-3-200RU 11.65 <0.0001 Tub-Sw-Sir2-4-etoh Tub-Sw-Sir2-4-200RU 15.30 0.00021 W1118 Het Sir2-1 1.29 0.00278 W1118 Het Sir2-3 1.48 0.00224 W1118 Het Sir2-4 1.88 <0.0001 ED Elav-Sw-W1118 Elav-Sw-Sir2-3 1.45 0.00234 Elav-Sw-Sir2-3 etoh Elav-Sw-Sir2-3-500RU 4.98 <0.0001 Tub-Sw-Myc2-etoh Tub-Sw-Myc2-100 1.87 0.00332 Tub-Sw-Myc2-etoh Tub-Sw-Myc2-200 3.78 <0.0001 Tub-Sw-Myc2-etoh Tub-Sw-Myc2-500 4.94 0.00029 Tub-Sw-Myc9-etoh Tub-Sw-Myc9-100 3.12 0.01865 Tub-Sw-Myc9-etoh Tub-Sw-Myc9-200 4.54 0.00068 Tub-Sw-Myc9-etoh Tub-Sw-Myc9-500 7.54 <0.0001 Supplementary Table 3. dSir2 and DNAJ-H mRNA Expression Levels for Figures 3 and S2 dnaJ-H and puc expression levels in reported conditions. Each row represents an experimental condition. Columns represent, in order from left to right: The control genotype, the increased dSir2 or GFP expression condition genotype, the dSir2 level as determined by qPCR, the p-value for dSir2 qPCR as determined by student’s t-test, the dnaJ-H level as determined by qPCR, the p-value for dnaJ-H levels as determined by student’s t-test, the puc level as determined by qPCR, the p-value for puc levels as determined by student’s t-test. Over-expression Condition Elav-Gal4-EP2300 Control Elav-Gal4-W1118 dSir2 Level 3.41 dSir2 pvalue <0.0001 DNAJ-H Level 0.745 DNAJ-H pvalue 0.34245 puc level 0.981 puc pvalue 0.18223 Elav-Gal4-Sir2-1 Elav-Gal4-W1118 12.72 0.00033 2.333 0.00025 2.456 0.00249 Elav-Gal4-Sir2-3 Elav-Gal4-W1118 6.196 0.00348 1.593 0.00377 1.862 0.01736 Elav-Gal4-Sir2-4 Elav-Gal4-W1118 7.136 0.00189 1.812 0.00512 2.303 0.0088 Elav-Switch-Sir2-1, 500 uM RU Elav-Switch-Sir2-1, etoh 32.946 <0.0001 Elav-Switch-Sir2-3, 500 uM RU Elav-Switch-Sir2-3, etoh 4.998 0.00036 Elav-Switch-Min UAS-Sir2, 500 uM RU Elav-Switch-Min UAS-Sir2, etoh 49.607 <0.0001 Tub-Switch-Min UAS-Sir2, 200 uM RU Tub-Switch-Min UAS-Sir2, etoh 24.825 <0.0001 2.863 <0.0001 Tub-Switch-Min UAS-Sir2, 50 uM RU Tub-Switch-Min UAS-Sir2, etoh 3.233 0.00358 0.414 <0.0001 Da-Gal4-UAS-GFP Da-Gal4-YW 2.681 0.0021 Supplementary Table 4. Primers used for qPCR amplification. Each row represents a primer pair used in qPCR, columns represent, in order from left to right: Transcript being measured, the forward primer sequence, and the reverse primer sequence. Gene Forward: Reverse: GAPDH GACGAAATCAAGGCTAAGGTCG AATGGGTGTCGCTGAAGAAGTC dSir2 GTCGAGAACGGCATCATGAAG GGAGCCGATCACGATCAGTAG DNAJ-H GGTCTCAGCCCCTTCGATAC AGGGACTGCACTTCTTGTCG puc GCCACATCAGAACATCAAGC CCGTTTTCCGTGCATCTT
