Transit time calculations The velocity and temperature time series
advertisement

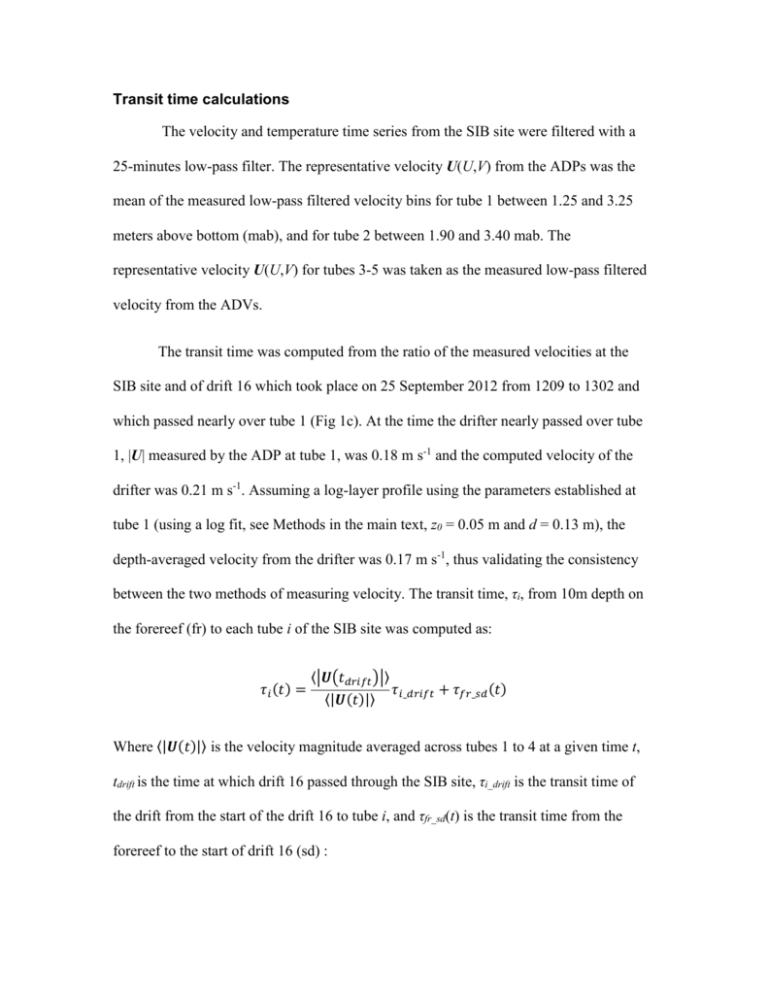
Transit time calculations The velocity and temperature time series from the SIB site were filtered with a 25-minutes low-pass filter. The representative velocity U(U,V) from the ADPs was the mean of the measured low-pass filtered velocity bins for tube 1 between 1.25 and 3.25 meters above bottom (mab), and for tube 2 between 1.90 and 3.40 mab. The representative velocity U(U,V) for tubes 3-5 was taken as the measured low-pass filtered velocity from the ADVs. The transit time was computed from the ratio of the measured velocities at the SIB site and of drift 16 which took place on 25 September 2012 from 1209 to 1302 and which passed nearly over tube 1 (Fig 1c). At the time the drifter nearly passed over tube 1, |U| measured by the ADP at tube 1, was 0.18 m s-1 and the computed velocity of the drifter was 0.21 m s-1. Assuming a log-layer profile using the parameters established at tube 1 (using a log fit, see Methods in the main text, z0 = 0.05 m and d = 0.13 m), the depth-averaged velocity from the drifter was 0.17 m s-1, thus validating the consistency between the two methods of measuring velocity. The transit time, τi, from 10m depth on the forereef (fr) to each tube i of the SIB site was computed as: 𝜏𝑖 (𝑡) = ⟨|𝑼(𝑡𝑑𝑟𝑖𝑓𝑡 )|⟩ 𝜏𝑖_𝑑𝑟𝑖𝑓𝑡 + 𝜏𝑓𝑟_𝑠𝑑 (𝑡) ⟨|𝑼(𝑡)|⟩ Where ⟨|𝑼(𝑡)|⟩ is the velocity magnitude averaged across tubes 1 to 4 at a given time t, tdrift is the time at which drift 16 passed through the SIB site, τi_drift is the transit time of the drift from the start of the drift 16 to tube i, and τfr_sd(t) is the transit time from the forereef to the start of drift 16 (sd) : 𝑠𝑑 𝜏𝑓𝑟_𝑠𝑑 (𝑡) = ∑ 𝑖=𝑓𝑟 𝑥𝑖 (𝐻𝑖 + 𝜂(𝑡)) 𝑞𝑠𝑑 (𝑡) Where xi is the distance between adjacent points on a modeled flow path between the forereef and the start of drift 16 (magenta line in Fig 1b), Hi is the mean depth at each point along the modeled flow path, η(t) is the measured tidal level, and qsd(t) is the depthintegrated flow at time t at the location of the start of drift 16: 𝑞𝑠𝑑 (𝑡) = ⟨𝑞(𝑡)⟩ 𝑞𝑠𝑑 (𝑡𝑑𝑟𝑖𝑓𝑡 ) ⟨𝑞(𝑡𝑑𝑟𝑖𝑓𝑡 )⟩ where ⟨𝑞(𝑡)⟩ = ⟨|𝑼(𝑡)|(𝐻 + 𝜂(𝑡))⟩ is the depth-integrated (H+η) Eulerian flow at the SIB site at time t averaged across tubes 1 to 4. Principal Components Analysis All community metabolic (NCC, NCP, NCC/NCP), environmental, and ecological data from the Eulerian sampling and drifts were aggregated to perform the PCA. Environmental measurements (PAR, air temperature, precipitation) were acquired from a weather station on the southwestern edge of the Palmyra Atoll runway. Ecological surveys conducted in 2010 at 12 sites on Palmyra’s WT were used to generate spatially interpolated landscapes of reef community composition metrics (Fig 1ESM). Spatially interpolated landscapes in the PS area were generated from ecological surveys conducted in 2010 (sites PSO, PSM, and PSI) and in 2012 (site SIB) (Fig 2ESM). Surveys were conducted using the point-count method and further details about benthic community structure and data collection methods can be found in Williams et al. (2013). Drift tracks were overlaid onto the interpolated landscape to determine mean drift values for community composition metrics used in the PCA (see Table S2 for listing of all ecological metrics used in the PCA). We used the ecological metrics of drift 16 as representative of the community composition over which the water flowed to reach the Eulerian sampling at the SIB site. The mean ecological metrics for drift 16 were very similar to the results of the ecological survey at the SIB site, suggesting that drift 16 serves as an ecologically representative flow pathway for the Eulerian samples. References Williams GJ, Smith JE, Conklin EJ, Gove JM, Sala E, Sandin SA (2013) Benthic communities at two remote Pacific coral reefs: effects of reef habitat, depth, and wave energy gradients on spatial patterns. PeerJ 1:e81 ESM Figure Legends Fig 1ESM: Spatially interpolated ecological landscapes on Palmyra’s WT. Black dots show survey locations Fig 2ESM: Spatially interpolated ecological landscapes at Palmyra’s PS backreef site. Black dots show survey locations and the sites are labeled in the top left panel Fig 3ESM: Diagram of drifter with dimensions. We used a bucket as a drogue located near the center of mass of the drifter. The surface expression of the drifter was minimal (approximately 10 cm)


