Energy Efficient Buildings
advertisement
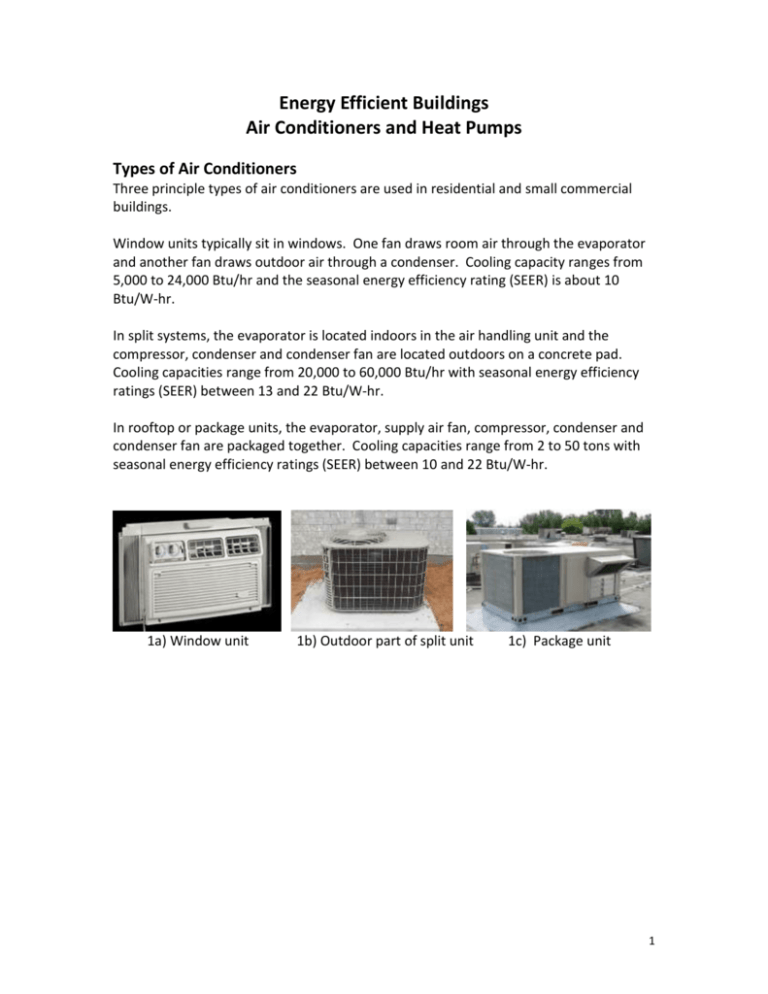
Energy Efficient Buildings Air Conditioners and Heat Pumps Types of Air Conditioners Three principle types of air conditioners are used in residential and small commercial buildings. Window units typically sit in windows. One fan draws room air through the evaporator and another fan draws outdoor air through a condenser. Cooling capacity ranges from 5,000 to 24,000 Btu/hr and the seasonal energy efficiency rating (SEER) is about 10 Btu/W-hr. In split systems, the evaporator is located indoors in the air handling unit and the compressor, condenser and condenser fan are located outdoors on a concrete pad. Cooling capacities range from 20,000 to 60,000 Btu/hr with seasonal energy efficiency ratings (SEER) between 13 and 22 Btu/W-hr. In rooftop or package units, the evaporator, supply air fan, compressor, condenser and condenser fan are packaged together. Cooling capacities range from 2 to 50 tons with seasonal energy efficiency ratings (SEER) between 10 and 22 Btu/W-hr. 1a) Window unit 1b) Outdoor part of split unit 1c) Package unit 1 The Vapor Compression Air Conditioning Cycle Ideal and actual vapor compression air conditioning cycles are shown below. Ideal Actual An energy balance on the system yields: comp Q cond 0 Q evap W SS Thus, condenser must reject heat from space plus compressor electricity comp Q cond Q evap W Air Conditioner Components Air conditioners have five primary components. 1. Condenser Heat Exchanger and Fan o Fin/tube HX to transfer heat from refrigerant to outdoor air o From energy balance, Qcond = Wcomp + Qevap o Condenser fan for a typical 3-ton unit draws about 3,000 cfm of air through the condenser at a very low pressure drop and uses about 220 W. 2 2. Evaporator Heat Exchanger and Fan o Fin/tube HX to transfer heat from indoor air to refrigerant o Evaporator is sized according to peak cooling load. cfm o Evaporator (supply air) fan ~ 400 cooling @ ΔPstatic .5in H2O ton o Evaporator supply-air fan for a typical 3-ton unit moves about 1,200 cfm across the evaporator at a pressure drop of about 0.5 in H20 and uses about 325 W. 3. Compressor o Compressors, which raise the temperature of the refrigerant to a high enough temperature that it can reject heat to the environment, are the biggest energy user in an air conditioning system. The work transferred to the refrigerant vapor by a compressor is: rev v dP W Compressors use much more power than pumps to deliver an equivalent pressure rise, because the specific volume of a vapor is much larger than for a liquid. For example, a compressor compressing water vapor would use about 1,600 times more power than a pump pumping water liquid to increase the pressure by an equivalent amount, since the specific volume of water vapor is about 1,600 times greater than liquid water. vg vap 1600 W liq for same ΔP! 1600 ! Thus, W v f water o For 3 ton AC, Wcomp ~2,700 W o Most residential air conditioners use scroll compressors. 4. Pressure Reduction Valve o Hard to see o Located at inlet to evaporator to minimize heat gain from environment 5. Refrigerant o The main design criterion is to find a substance that changes from liquid to vapor at proper temperatures and pressures. o Also want non-toxic, non-corrosive, low cost, etc. o The first refrigerant was ammonia. o Low cost, good thermal properties, but toxic o 1930s Dupont & GM develop CFCs = Freon = R11& R12 o “Answer” to all problems o 1970s – Discover that CFCs destroy upper atmospheric ozone and increase UV 3 o 1980s – Discover that CFCs are potent green house gasses o Response is: o Montreal Protocol to phase out CFCs o Revised Montreal Protocol (1987) says no CFCs after 1995 and no HCFCs after 2010 o CFC = Freon (bad) HCFC R123, R22 (better) HFC = Puron = R410a (best) o For a 3-ton AC o Diameterliquid line 5 " , Diametersuction line 3 " 15 4 o Charge R22 ≈ 116oz. Power Use Breakdown Electrical energy use by component for a typical 3-ton air conditioner is shown below. tot W cond fan W evap fan W comp 220 W 325 W 2,700 W 3,245 W W The fractional breakdown of energy use by component is: evap fan W 325 9% Wtot 3245 cond fan W 220 7% Wtot 3245 comp 2700 W 84% tot W 3245 Efficiency and Coefficient of Performance (COP) Efficiency is the ratio of useful output to required input. For an air conditioner, the useful ‘output’ is the heat removed from the space and the required input is the electrical energy. The efficiency ( of devices such as air conditioners and refrigerators that extract more energy from a space than electrical energy consumed is also called Coefficient of Performance (COP): η Q Q evap Euseful evap COP comp Q cond Q evap Erequired W Efficiencies of Ideal and Actual Systems In an ideal system, the compressor and pressure reduction valve operate isentropically with no entropy generation, and all heat transfer to and from the evaporator and condenser occurs at constant temperature as shown in the figure below. Heat transfer by the evaporator and condenser is the product of the temperatures and entropy changes. Q TcondΔS Q TdS cond T and Q Q evap Tevap ΔS cond 4 1 2 3 Q evap 4 S Thus, the efficiency of an ideal Carnot air conditioner is given by: ηcarnot Q evap Tevap Δs Tevap Q cond Q evap TcondΔs Tevap Δs Tcond Tevap Moreover, in an ideal system, the evaporator and condenser are infinitely large so heat can be transferred into and out of the refrigerant with no temperature difference between the refrigerant and the air. Thus, the evaporator temperature is equal to the temperature of the space being cooled and the condenser temperature is equal to the outside air where heat is being rejected. Tcond Toutside air Tevap Tinside air Hence, the efficiency of an ideal air conditioner operating between an indoor air temperature of 70 F and an outside air temperature of 90 F is: ηcarnot Tia 70 460 26.5 Toa Tia 90 460 70 460 This indicates that an ideal air conditioner could transport 26.5 times more cooling energy than work input energy! Unfortunately, actual air conditioners have lots of irreversibilities and the efficiency of actual air conditioners operating between these temperatures is about 3.5. This demonstrates the tremendous potential for improving the performance of air conditioners by reducing friction, turbulence, temperature differences and motor inefficiencies. Energy Efficiency Ratio (EER) Another measure of air conditioner efficiency is energy efficiency ratio (EER). EER is dimensional measure of efficiency at conditions specified by Air-Conditioning & Refrigeration Institute (ARI). EER Q evap Btu @ ARI elec W h W Q evap comp W cond fan W evap fan W Btu W h @ ARI ARI conditions for determining the EER of air conditioners are: 5 Tia 80F, Tia, wb 67F, Toa 95F, Seasonal Energy Efficiency Ratio (SEER) Another measure of efficiency is seasonal energy efficiency ratio (SEER). SEER attempts to characterize the average efficiency over an entire cooling season. SEER is determined by measuring air conditioner performance at more moderate conditions than the standard used to measure EER. SEER Seasonal Energy Efficiency Ratio Btu Q evap @ SEERconditions W comp W cond fan W evap fan W h ARI conditions for measuring the SEER of air conditioners are: Tia 80F, Tia, wb 67F, Toa 80F, Thus, SEER is greater than EER since Toa is lower. For example an air conditioner with an EER of 10.75 may have an SEER of 12. Minimum Efficiency Standards On August 17, 2004, the U.S. Department of Energy published a technical amendment on minimum efficiency standards for residential air conditioners and heat pumps (DOE, 2008). The amendment stated that all residential air conditioners and heat pumps manufactured after January 23, 2006 would have to meet the following standards. On January 12, 2001, the U.S. Department of Energy published a final rule on energy efficiency standards for commercial package air conditioners and heat pumps (DOE, 2008). The rule raised the previous EPCA standards to those adopted by ASHRAE 90.1 6 1999 for all equipment manufactured after October 29, 2003 or October 29, 2004 for large packaged units. The previous and new standards are shown below. Efficiency Standards for Commercial Package Air Conditioners and Heat Pumps On Novermber 11, 2004, the U.S. Department of Energy recommended new standards for commercial package air conditioners and heat pumps pumps (DOE, 2008). The recommendation was that commercial package air conditioners and heat pumps manufactured after January 1, 2010 would have to meet the following standards. Where two EERs are listed, the first refers to systems with electric resistance heat or no 7 heating, and the second refers to systems with all other heating-system types that are integrated into the unitary equipment. Air-Cooled Products >65,000 - <135,000 Btu/h >135,000 - <240,000 Btu/h Efficiency Standards 11.2/11.0 EER for Air Conditioners 11.0/10.8 EER for Heat Pumps 3.3 COP @ 47ºF for Heat Pumps 11.0/10.8 EER for Air Conditioners 10.6/10.4 EER for Heat Pumps 3.2 COP @ 47ºF for Heat Pumps Efficiency Standards for Residential Air Conditioners and Heat Pumps Energy Star Energy Star rating for products in top 15% of energy efficiency. Q cond Energy Use Example Calculate daily cost of running AC if cooling load on house is: Wcomp Q evap Q CL AC Btu Btu 12,000 , SEER 10 , and electricity costs $0.10 per kWh. hr W h CL Q evap 0, Q evap Q CL , SEER E-balance on house: Q Q evap Q elec evap , , W elec W SEER elec Δt UC elec Q CL Δt UC elec Celec W SEER hr 1 kW Btu 1 W hr $ $2.88 12,000 24 0.10 day hr 10 Btu 1000 W kWh day The Effect of Outdoor Air Temperature on Capacity and Efficiency PH dQ=TdS Q evap Area under 2 3 //// Q cond Area under 4 1 \ \ \ \ Wcomp Net area under 4 1 and above 2 3 Q cond T Tcond Toa 4 1 PL Wcomp 3 2 Q evap S 8 This means that when Toa increases, o ΔT Tcond Toa decreases and Q cond decreases o With less heat removed by the condenser, Tcond increases comp (area in the box) increases and η decreases o When Tcond increases, W o Thus, as Toa ↑, η ↓ comp increases… o Also, when Q cond decreases, and W evap Q cond W comp Q evap decreases o Q o Thus, as Toa ↑, Q evap ↓ In summary: COP Q evap cooling capacity Toa Thus, lowering outside air temperature increases both efficiency and cooling capacity. Air Conditioning Psychrometrics The properties of moist air as it passes over an evaporator coil are shown on the psychrometric chart below. When air traveling over the evaporator is cooled below its dew-point temperature, water condenses out of the air and it becomes dryer. The total cooling is: V a h1 h2 1 h1 h2 Q tot m v1 The total cooling can be decomposed into latent and sensible cooling Q tot Q lat Q sen a h1 h2 m a h2 h2 Q tot m The amount of water removed is: 9 w m a w1 w2 m V1 w1 w2 v1 V1 (ft3/lba) h1 h2' 1 h2 (ft3/lba) ω1 (lbw/lba) Qlat 2 T2(F) Qsen 2' ω2 T1 Air Conditioning Sizing and Duct Systems The Air Conditioning Contractors of America (ACCA) reports that 70% of air conditioners are oversized. Oversizing, especially in humid climates, decreases the ability of the air conditioner to remove moisture from the air and may increase humidity control problems. Manufacturers expect air conditioners to be coupled to an efficient duct system with 0.5" of static pressure drop across the fan. The static pressure drop created by the duct system in the average home is 1.8" water column, which is over 3 times greater than the design pressure drop. A major contributor to this pressure drop is undersized return air systems. Up to 90% of houses have return air filter grilles and ducting that are too small. At these pressure drops, air flow to the house is dramatically reduced, which compromises system performance. According to the Air Conditioning Contractors of America (ACCA), an acceptable duct leak rate is 3%; however, the average house has a 35% to 44% leak rate. This causes ducting to lose about 1/3 of the air that should be delivered to the space. If this air is lost to unconditioned space such as the attic, it will cause under-pressurization of the conditioned space and drive infiltration. Infiltration air often enters from the attic at temperatures as high as 130 F. Thus, poor duct systems compromise the performance of even the highest efficiency air conditioners (Galveston Air Conditioning, 2008). 10 Heat Pumps An air conditioner can be called a “heat pump”, since it “pumps heat uphill” from Tia (~ 70°F) to Toa (~90°F). Toa Q OA WE Tia Q HP QH AC This suggests that the same technology could be used during winter to heat a house by “pumping heat uphill” from the outside air at a low temperature to the inside air at a higher temperature. Heat pumps are air conditioners that have been modified to pump heat into a house during winter and out of a house during summer. Toa Q OA WE Q HP Tia QH HP heat in winter and cool in summer HP Heat pumps are a good choice for climates with moderate heating requirements since the a heat pump eliminates the need for natural gas service and a separate furnace, and since heat pump performance is better at moderate temperatures than extreme temperatures. Heat Pump Components Heat pumps are made of the same components as air conditioners. However, the diagrams below show how heat pumps reverse the flow of the refrigerant during cooling and heating modes. This is accomplished using four valves and bypass piping around the compressor. It enables the interior heat exchanger to act as a condenser when the heat pump is in heating mode and an evaporator when in cooling mode. Similarly, the exterior heat exchanger acts as an evaporator when the heat pump is in heating mode and a condenser when in cooling mode. 11 Q HP (From Tia) Q HP ( To Tia ) 1 4 2 1 COND Comp Piping/Value Detail EVAP WE (HEATING) WE (COOLING) COND EVAP 2 B 3 4 3 A A B Cool A Open B Closed Heat A Closed B Open Q A ( To Toa ) Q A (From Toa) Ideal and Actual Heating Cycles As in cooling mode, an ideal heating cycle has isentropic compression and expansion, and negligible temperature differences between the air and refrigerant in the evaporator and condenser. When operating between 30 F outside and 70 F inside, the ideal Carnot efficiency is about 13.25, as shown below. η Euseful COP Q H Q HP Erequired WE Q HP Q A η THds 14 THds 14 TAds 23 for Carnot : ds 14 ds 23 , TA Toa , TH Tia ηc Tia Tia Toa For Tia 70F and Toa 30F ηc 70 460 13.25 70 460 30 460 In an actual cycle the temperature differences between the air and refrigerant in the evaporator and condenser is at least 10 F. These temperature differences alone reduce the efficiency to 9.0. Friction, turbulence, heat gain and motor inefficiency reduce the actual efficiency during heating mode to about 1.5 to 3.0. This indicates the tremendous potential for improved energy efficiency with improved design. PH 4adb 4s T ΔTHX 10F 4act PL 1 2 η 70 10 460 9.0 70 10 460 30 10 460 3 S 12 The Effect of Outdoor Air Temperature on Capacity and Efficiency As shown in the figures below, heat pump capacity and efficiency decline as outdoor air temperature decreases. - T 4 1 TA - As Toa decreases, ΔTevap = Toa – TA decreases, so Q A decreases A W e As Q A decreases, so Q HP Q does Q HP - 3 2 Thus, as Toa ↓, Q HP (heating capacity) ↓ QHP S Q evap Toa - T 1 4 - E As Toa ↓, TA ↓ from TA1 to TA2, thus W ↑ Thus, as Toa ↓, η (= COP) ↓ 2 TA1 TA2 3 WE COP Toa S Heat Pump Efficiency Performance Metrics As for air conditioners, the average cooling efficiency of heat pumps is characterized using Seasonal Energy Efficiency Rating (SEER). SEER Q HP Btu e W h W Average heating efficiency is characterized using Heating Season Performance Factor (HSPF). HSPF Q HP Btu e W h W 13 The corresponding Coefficient of Performance (COP) is. W h COP 3.412Btu W h SEER Btu COP W h 3.412Btu W h HSPF Btu Testing procedures for SEER and HSPF are specified in ANSI/AHRI Standard 210/240 2008 (formally ARI 210/240). As of 2011, minimum SEER is 13.0 and the minimum HSPF is 8.0. Manufacturers typically offer models with efficiencies ranging between about 13 to 18 SEER and 8.0 to 9.5 HSPF. Heat Pump Sizing and Balance Temperature The size of an air conditioner or furnace is typically selected so that the equipment can deliver the required cooling or heating at the most extreme conditions expected in a given climate. However, heat pumps supply both heating and cooling, and peak heating and cooling loads are rarely identical. Thus, a heat pump could be sized to meet the peak cooling load or the peak heating load, but rarely can it be sized to meet both peak loads. In most cases, the size of the heat pump is determined to meet the peak cooling load. This eliminates the problem of over sizing the unit and creating humidity control problems, or under sizing the unit and not being able to deliver enough cooling. If sizing for the peak cooling load results in extra heating capacity, there is no significant heating performance penalty. If sizing for the peak cooling load results in insufficient heating capacity, the additional heat is typically supplied using electric resistance heating. The quantity of electrical resistance heating required can be determined using the concept of a heat pump balance temperature. To understand heat pump balance temperature consider the following graph. Heating capacity of a heat pump decreases and the heating load of a house increases at colder outdoor air temperatures. The outdoor air temperature where the heat pump capacity equals the heating load is called the heat pump balance temperature. Below this temperature, additional heat is supplied to the house by electrical resistance heating. 14 Q Toa QA WE QHP,bigger QHP QH = UA(Tia-Toa) Under Capacity Auxiliary Heat Tia Over Capacity QHP QH HP (In Heating Mode) TBal,HP TBal,HP,bigger TC Ground-Source Heat Pumps Air-source air conditioner efficiency and capacity decline at high ambient air temperatures when cooling loads are typically largest. Similarly, air-source heat pump heating efficiency and capacity decline at low ambient air temperatures when heating loads are typically largest. Ground-source heat pumps reject and extract heat from the ground rather than from the air. The temperature of the ground a few feet below the surface is close to the annual average temperature. Thus, the ground is typically cooler than the air during summer and warmer than the air during winter. This energy storage capacity results in a cooler sink for heat extracted from buildings during the summer and a warmer source of heat for buildings during winter. Thus, using the ground as a heat sink and source increases the efficiency and capacity of a heat pump in both cooling and heating modes. This principle is demonstrated by the figures below. Q HP 1 Winter Heating Mode T 90F TG TOA TOA 4 2 50F WE 3 TG Ground Loop QG WE , pump 10F QG for TG In winter, source of heat @ TG > Toa. Increases η & Q HP In summer, sink for heat @ TG < Toa. Increases η & Q HP 15 Water-to-air systems use water in the ground-loop and produce warm or cool air for the house. Water-to-water systems use water in the ground loop and produce warm or cool water for domestic hot water and/or hydronic heating and cooling. As of 2008, about 1 million ground-source heat pump systems have been installed in the U.S. and about 50,000 new systems are installed each year (Masia, 2008). Typical Ground-Source Heat Exchanger Configurations Ground-source heat pumps exchange heat with the ground by pumping fluid through polyethylene or plastic tubing. The tubing can be configured in buried coils or vertical shafts. Coils of tubing can also be submerged in water. In open systems, well water is pumped to the heat pump and then discharged. A 3-ton system requires about 1,500 linear feet of looped buried polyethylene coils. Source: www.energysavers.gov/your_home/space_heating_cooling/ 16 In both types of systems, pumping energy is a parasitic load which reduces the overall energy efficiency of the system and is not included in heat-pump performance metrics. Pumping energy can be reduced by control systems that employ variable speed pumps and reduce water flow during periods of low loads. Efficiency Ratings for Ground-Source Heat Pumps ARI has three standards for rating ground-source heat pumps, but none of these standards actually represent average seasonal performance H/C Enter Water Temp H/C Entering Air Τemp Pump Work ARI 320 Water Source 70/85 70/80 ARI 325 Ground ARI 330 Water Source 50/70 32/77 70/80 70/80 Gpm*[(5*ΔPpsi)+65] .8*gpm*(ΔPftH2O+17) Performance specifications for a typical nominal 2-ton ground-source heat pump are shown below. ISO 13256-1PERFORMANCE DATA Rated at 800 CFM and 5.0 GPM Water Loop Ground Water Ground Loop Cooling Heating Cooling Heating Cooling Heating Capacity EER Capacity COP Capacity EER Capacity COP Capacity EER Capacity COP 25,500 15.2 29,000 5.1 29,500 24.3 22,600 4.3 27,400 18 17,500 3.6 COOLING EFT Range (Standard), 45°F to 110°F. All performance at 350 CFM and 3.0 GPM Entering Fluid Temp. 50° 70° 100° Ent. Air Total Wet Bulb Capacity Temp. BTUH 61° 28028 64° 29387 67° 30769 70° 32174 73° 33601 61° 25605 64° 26847 67° 28109 70° 29392 73° 30696 61° 21971 64° 23036 67° 24119 70° 25220 73° 26339 Watts Input 1158 1183 1209 1235 1261 1502 1535 1569 1603 1637 2019 2084 2109 2154 2200 Heat Sensible Capacity BTUH Rejection Ent. Air Dry Bulb Temp. BTUH 75° 80° 85° 31978 21330 25580 28025 33424 19954 25332 28094 34894 18368 24000 27692 36387 15316 21170 27541 37904 18044 24730 30731 19488 23378 25605 32086 18229 23142 25685 33462 16781 21925 25298 34861 13891 19340 25160 36281 16484 22592 28860 16720 20059 21971 30078 15841 19357 22022 31315 14399 18513 21707 32571 12005 16595 21558 33845 14144 19385 EER 24.2 24.5 25.4 26.1 26.6 17.0 17.5 17.9 18.3 18.8 10.9 11.2 11.4 11.7 12.0 17 HEATING EFT Range (Standard), 25°F to 80°F. All performance at 350 CFM and 3.0 GPM Entering Fluid Temp. 50° 80° Heating Heat of Power Dry Capacity Abs. Input COP Bulb BTUH BTUH Watts 60° 25433 19818 1546 4.6 70° 24124 18402 1677 4.2 80° 22585 16743 1712 3.9 60° 35523 29294 1826 5.7 70° 33694 27348 1860 5.3 80° 31544 25065 1899 4.9 CONDENSER Water Flow (GPM) Press. Drop (FOH) 2.0 1.0 3.0 2.3 4.0 4.1 5.0 6.4 6.0 9.2 8.0 16.4 BLOWER Power (hp) Static Pressure (inches water) Speed (RPM) 0.5 0.6 800 The U.S. Department of Energy estimates that residential scale ground-source heat pump systems have an installed cost of about $2,500 per ton and payback in about 5years (Masia, 2008). References Figure 1a: http://www.energystar.gov/ia/news/images/roomac-sm.jpg Figure 1b: http://cstx.gov/images/1630102812004energy_16.jpg Figure 1c:http://upload.wikimedia.org/wikipedia/commons/9/90/ Department of Energy, 2008, http://www1.eere.energy.gov/buildings/appliance_standards/ Galveston Air Conditioning, 2008, http://www.galvestonairconditioning.com. Masia, S., 2008, “Ground-source heating”, Solar Today, Vol. 22. No. 6. 18
