Direct and Indirect
advertisement
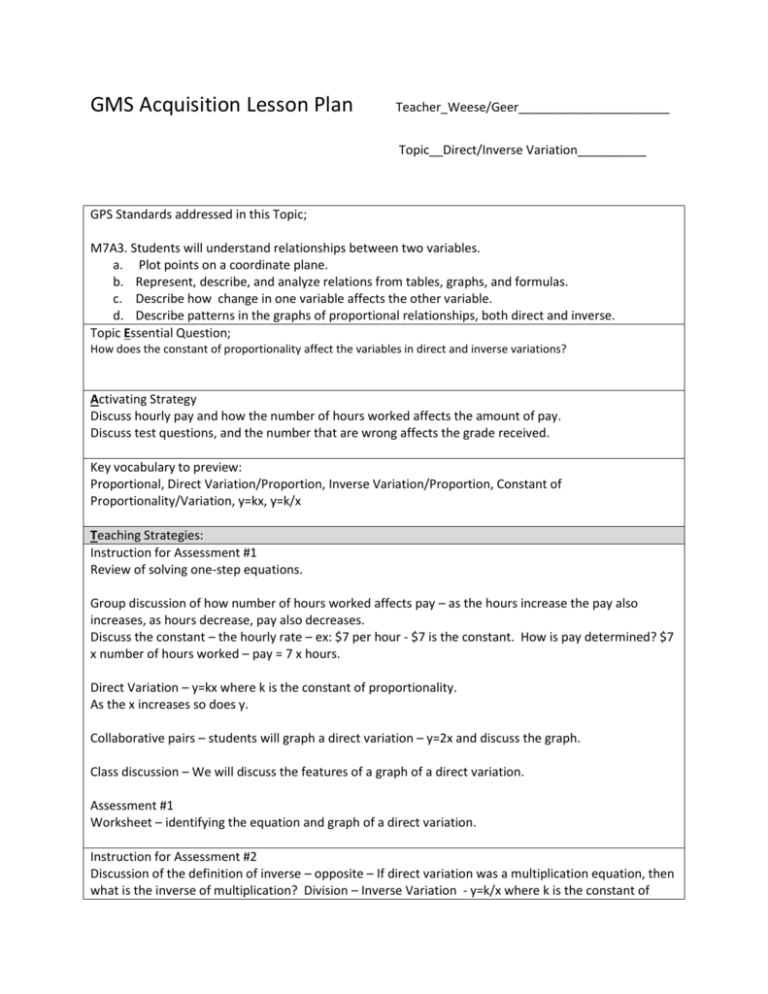
GMS Acquisition Lesson Plan Teacher_Weese/Geer______________________ Topic__Direct/Inverse Variation__________ GPS Standards addressed in this Topic; M7A3. Students will understand relationships between two variables. a. Plot points on a coordinate plane. b. Represent, describe, and analyze relations from tables, graphs, and formulas. c. Describe how change in one variable affects the other variable. d. Describe patterns in the graphs of proportional relationships, both direct and inverse. Topic Essential Question; How does the constant of proportionality affect the variables in direct and inverse variations? Activating Strategy Discuss hourly pay and how the number of hours worked affects the amount of pay. Discuss test questions, and the number that are wrong affects the grade received. Key vocabulary to preview: Proportional, Direct Variation/Proportion, Inverse Variation/Proportion, Constant of Proportionality/Variation, y=kx, y=k/x Teaching Strategies: Instruction for Assessment #1 Review of solving one-step equations. Group discussion of how number of hours worked affects pay – as the hours increase the pay also increases, as hours decrease, pay also decreases. Discuss the constant – the hourly rate – ex: $7 per hour - $7 is the constant. How is pay determined? $7 x number of hours worked – pay = 7 x hours. Direct Variation – y=kx where k is the constant of proportionality. As the x increases so does y. Collaborative pairs – students will graph a direct variation – y=2x and discuss the graph. Class discussion – We will discuss the features of a graph of a direct variation. Assessment #1 Worksheet – identifying the equation and graph of a direct variation. Instruction for Assessment #2 Discussion of the definition of inverse – opposite – If direct variation was a multiplication equation, then what is the inverse of multiplication? Division – Inverse Variation - y=k/x where k is the constant of proportionality. As x increases, y decreases. Collaborative pairs – students will graph an inverse variations – y=12/x and discuss the graph. Students will complete a double bubble map comparing and contrasting the graphs of a direct and indirect variation. Class discussion of the double bubble maps – graphs of inverse proportion. Assessment #2 Worksheet – identifying equations and graphs of direct and inverse variations Instruction for Assessment #3 Finding the constant of proportionality given x and y. Lecture – how to find the constant of proportionality give that y varies directly as x and y is 12 when x is 4. Discussion of how to plug the numbers into the equation of a direct variation and solve for k. Also how to solve for inverse variations when given y and x. Assessment #3 Finding the constant of proportionality in direct and inverse variations. Instruction for Assessment #4 Finding the missing x or y value in direct and inverse variations. Determining the constant of proportionality, then finding a missing value. Given the relationship determine how a change in one variable will affect the other variable. Assessment #4 Worksheet – Direct/Inverse Variation – finding the missing value. Graphic Organizer and/or Extended Thinking Frayer model for vocabulary. Double Bubble Map – compare/contrast the graphs of direct and inverse variations. Summarizing Strategy: Verbal Summary/Ticket out the Door/Think Pair Share Accommodations: Preview vocabulary, collaborative pairs, copies of notes, extended time, shortened assignments.
