election theory project
advertisement
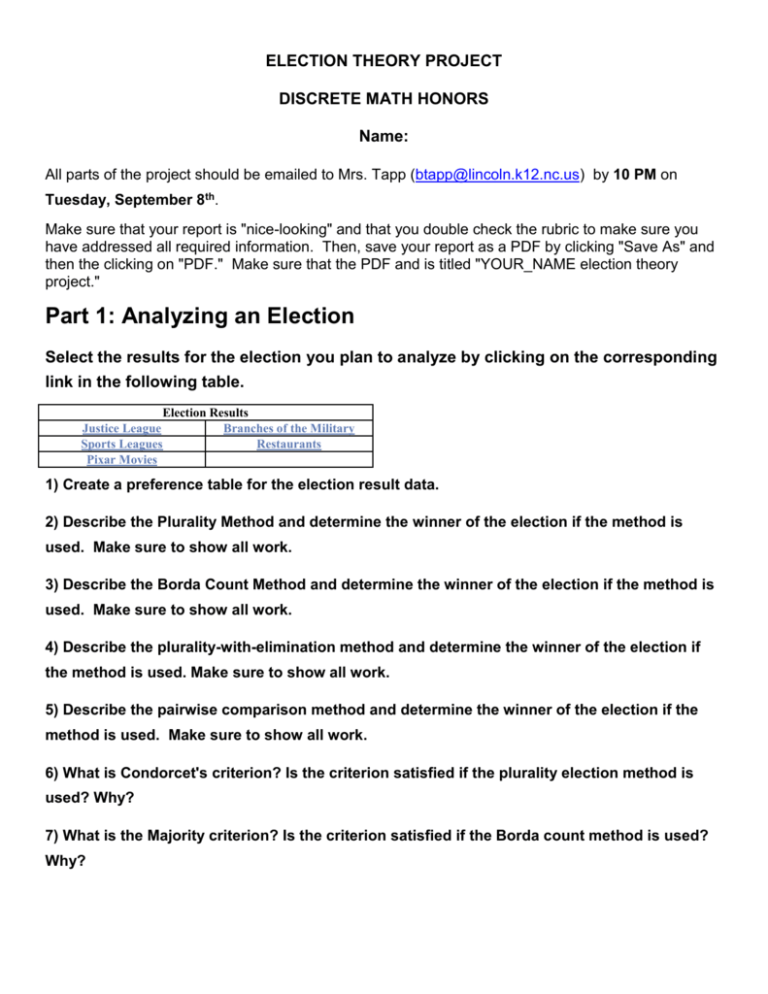
ELECTION THEORY PROJECT DISCRETE MATH HONORS Name: All parts of the project should be emailed to Mrs. Tapp (btapp@lincoln.k12.nc.us) by 10 PM on Tuesday, September 8th. Make sure that your report is "nice-looking" and that you double check the rubric to make sure you have addressed all required information. Then, save your report as a PDF by clicking "Save As" and then the clicking on "PDF." Make sure that the PDF and is titled "YOUR_NAME election theory project." Part 1: Analyzing an Election Select the results for the election you plan to analyze by clicking on the corresponding link in the following table. Election Results Justice League Branches of the Military Sports Leagues Restaurants Pixar Movies 1) Create a preference table for the election result data. 2) Describe the Plurality Method and determine the winner of the election if the method is used. Make sure to show all work. 3) Describe the Borda Count Method and determine the winner of the election if the method is used. Make sure to show all work. 4) Describe the plurality-with-elimination method and determine the winner of the election if the method is used. Make sure to show all work. 5) Describe the pairwise comparison method and determine the winner of the election if the method is used. Make sure to show all work. 6) What is Condorcet's criterion? Is the criterion satisfied if the plurality election method is used? Why? 7) What is the Majority criterion? Is the criterion satisfied if the Borda count method is used? Why? Part 2: Analyzing a Weighted Voting System Dan (D), Carol (C), Tamara (T), and Frank (F) are all members of the Euler Institute for Discrete Mathematics and its Applications (EIDMA) Executive Board. To make decisions for the organization, a weighted voting system was created. A total of 20 votes must be reached for any resolution to pass. Dan's vote is worth 5, Carol's vote is worth 6, Tamara's vote is worth 8, and Frank's vote is worth 9. 1) Create a table listing all possible coalitions, the weight of each coalition, whether the coalition is a winning coalition or not, and which voters are critical in each coalition. Use the first letter in a voter's name to represent the voter. 2) Find the Banzhaf Power Index (BPI) for each voter. 3) Write a paragraph summarizing your findings. Be sure to rank each voter from the most powerful to the least powerful. Part 3: The Electoral College 1) Write a paragraph describing why the Electoral College is a weighted voting system. Describe what the Electoral College is and how it works. Please include a link to any resources you used to obtain your information. Simply copy and paste any websites used as long as they are reliable sources. 2) Using the information given below, choose at least two states other than California and Wyoming with different numbers of electoral votes. Calculate the Banzhaf power index of an individual voter in each of these states. Consider how this reflects upon the U.S. Electoral College system. Use this evidence in writing a letter to the editor (one paragraph in length) arguing for or against eliminating the Electoral College. Your calculations of each of your two states’ Banzhaf power index should be included as evidence in your letter. State populations can be found by going to http://quickfacts.census.gov/qfd/. Read the next pages to determine how to do your calculations. We could use the Banzhaf power index to measure the relative power of the U.S. states in the Electoral College. The table below shows the Banzhaf power index for each state (not the power of an individual from that state). The Electoral College and The Banzhaf Power Index Number of Votes Percent of all Electoral College Votes Banzhaf Power Index CA 55 10.22 11.41 TX 34 6.32 6.39 NY 31 5.76 5.79 FL 27 5.02 5.01 IL, PA 21 3.90 3.87 OH 20 3.72 3.68 MI 17 3.16 3.12 GA, NC, NJ 15 2.79 2.74 VA 13 2.42 2.37 MA 12 2.23 2.19 IN, MO, TN, WA 11 2.04 2.01 AZ, MD, MN WI 10 1.86 1.82 AL, CO, LA 9 1.67 1.64 KY, SC 8 1.49 1.46 CT, IA, OK, OR 7 1.30 1.27 AR, KS, MS 6 1.12 1.09 NM, NV, UT, WV 5 0.93 0.91 HI, ID, NH, RI 4 0.74 0.73 AK, DE, DC, MT, ND, SD, VT, WY 3 0.56 0.55 ME, NE 2 0.37 0.36 Congressional districts (5 in all) 1 0.19 0.18 State We will look at the power of an individual from a certain state relating to the presidential election. However, let’s first review the apportionment of electoral votes (i.e. the division and allocation of Electoral College votes to states) in relation to states’ share of the U.S. population. It is well known that there is a bias in favor of small states in this apportionment – For example, consider California (a large state) and Wyoming (a small state). Population of CA: 36,000,000 Electoral College Votes for CA: 55 A California voter’s share of the state’s electoral votes: 55/36,000,000 = .0000015 Population of WY: 500,000 Electoral College Votes for WY: 3 A Wyoming voter’s share of the state’s electoral votes: 3/500,000 = .000006 (4 times as large) There is a popular belief that this implies an individual voter in Wyoming has 4 times as much power as an individual voter in California. However, that is not true. Let’s analyze the situation carefully and quantitatively. First, we note that the process of electing a president in the U.S. is actually a two-stage voting system. In the first stage, individual voters from the state vote for president to find which candidate wins that state. Then (in almost all states), the state uses all of its electoral votes to vote in the electoral college for the candidate that won the state. To continue, let’s compare the voting power of an individual voter in California and a voter in Wyoming. Intuitively: In the first stage, the Wyoming voter has a greater chance of being a critical voter, simply because there are fewer other voters in Wyoming and so that voter has a larger (though still very small) chance of breaking what would otherwise be a tie in the Wyoming popular vote. On the other hand, while the voter in California has a smaller chance of casting a decisive vote, if that voter does cast a decisive vote, it is much more likely to determine the outcome of the Presidential election, because it will tip 55 (rather than 3) electoral votes into one candidate’s column or the other’s. The question is, how do these relative advantages and disadvantages balance out? Because of the huge number of possible coalitions of voters in an individual state, it is impossible to calculate directly the Banzhaf power index of an individual voter within a state. However, statistical theory tells us that an individual voter’s “likelihood” of being a critical voter in a coalition within a state is roughly proportional to 1n , where n is the population of the state. Because an individual voter’s likelihood of being a critical voter within a state and the likelihood of that state being a critical voter in the Electoral College are independent events, it can be shown that the Banzhaf power index of an individual voter in a state with population n is roughly proportional to 1n times the Banzhaf power index of the state. So, a quantitative analysis of the voting power of an individual voter in California and a voter in Wyoming goes as follows. 1. The Banzhaf power index of a voter in California is roughly proportional to: 1 11.41 .0019 36,000,000 2. The Banzhaf power index of a voter in Wyoming is roughly proportional to: 1 .55 .00078 500,000 3. Since .0019/.00078 = 2.4,the Banzhaf power index of an individual voter in California is about 2.4 times that of the individual voter in Wyoming.


