Topic 5: Continuous Probability Distributions
advertisement

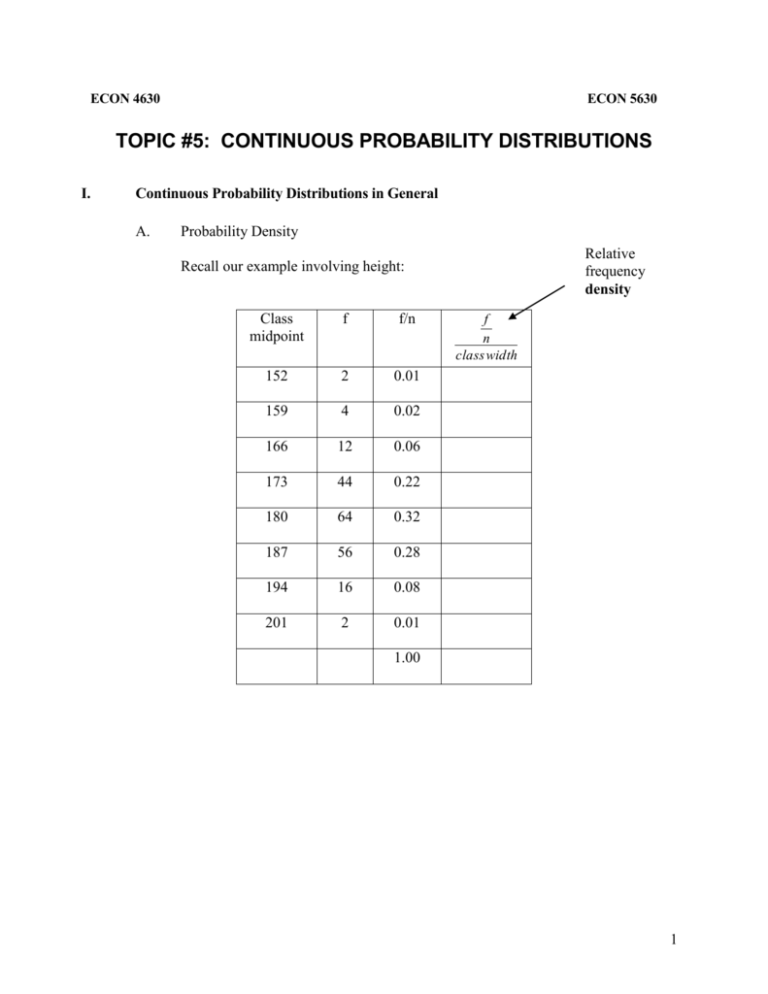
ECON 4630 ECON 5630 TOPIC #5: CONTINUOUS PROBABILITY DISTRIBUTIONS I. Continuous Probability Distributions in General A. Probability Density Relative frequency density Recall our example involving height: Class midpoint f f/n 152 2 0.01 159 4 0.02 166 12 0.06 173 44 0.22 180 64 0.32 187 56 0.28 194 16 0.08 201 2 0.01 f n class width 1.00 1 f f/n 60 0.30 40 0.20 20 0.10 152 159 166 173 180 187 194 201 rel. freq. density If I now graph with relative frequency density on the vertical axis, I get a rescaled version of this picture: 0.04 0.025 0.01 152 159 166 173 180 187 194 201 2 What is the total area of the shaded region? B. Continuous Probability Densities What happens when we increase the sample size and decrease the class interval? 3 II. III. Mean and Variances of Continuous-Distributed Variables A. Mean of a Continuous-Distributed Variable B. Variance of a Continuous-Distributed Variable The Standard Normal Distribution A. General information Many variables have as their probability distribution the normal or Gaussian curve. This is the familiar bell curve. B. The Standard Normal 1. Definition: A random variable Z is distributed standard normal if its probability density function is: 4 2. A crude plot: 5 3. Characteristics of the Standard Normal 4. Mean and Variance of Standard Normal 5. Using the standard normal table: examples Example #1: What is the probability that Z exceeds 1.6? 6 Example #2: What is the probability that Z is between –1 and +1? Example #3: P(Z < -1.81) 7 Example #4: P(-1.11 < Z < 0.19) Example #5: P(0.35 < Z < 1.17) 8 9 IV. The General Normal A. Distinction between standard and general normal The standard normal is a very specialized distribution. It has a mean of 0 and a standard deviation of 1. The general normal can have any mean and standard deviation B. Definition: A random variable X is distributed general normal with a mean of μ and a standard deviation of σ if its probability density function is: C. Using the standard normal table with a general normal variable: 10 D. Examples Example #1: A bolt picked at random from a production line has length X. X is distributed normally with = 78.3 millimeters and = 1.4 millimeters. If all bolts longer than 80 millimeters have to be discarded, what proportion of output is wasted? 11 Example #2: The shape of a frequency curve showing the length of drive, D, for a particular golf pro is close enough to be normal to be treated as such. The mean drive is 237 yards with a standard deviation of 45 yards. If the pro hits 8,000 drives in the course of a year, how many of them would you predict will be between 256 and 290 yards? 12 Example #3: Prof. Nasty-Domy has, shall we say, a limited social life (this is an occupational hazard among economists and others, including dentists and morticians). To fill his lonely and pathetic evenings, he plays the handheld Yahtzee game that his granny gave him back in 1996. He has discovered that over the many thousands of games he has played, his average score is 237, with a variance of 2000. (a) What is the probability that he will score more than 400? (b) What is the probability that he will score less than 200? (c) What is the probability that his score will be somewhere between 250 and 300? 13 Example #4: Working “Backwards:” So far, we’ve figured out the probability based on some X or Z value. However, sometimes we need to know the X or Z value based on the probability. Example #3: Suppose the average height of men is 180 cm, with a standard deviation of 8. What is the 99th height percentile? (OR, 99% of men are at least what height?) 14 Example #5: The average birthweight for babies at a certain hospital is 6.78 pounds, with a standard deviation of 0.45 pounds. Treat as normal the frequency curve that shows the distribution of these weights. a) What is the probability that a baby born at this hospital has a weight between 6 and 7 pounds? b) What percentage of babies born weigh at least 8 pounds? c) Unusually small babies are given special attention. If the hospital defines “unusually small” as having a birth weight in the first quartile, what is the maximum birth weight that merits special attention? 15 E. Excel Commands =NORMDIST(x, μx, σx, cumulative) Where μx is the mean σx is the standard deviation cumulative is “TRUE” for the cumulative distribution 16 NOTES: 17


