Analysis Questions: Dating the Fossil Record
advertisement
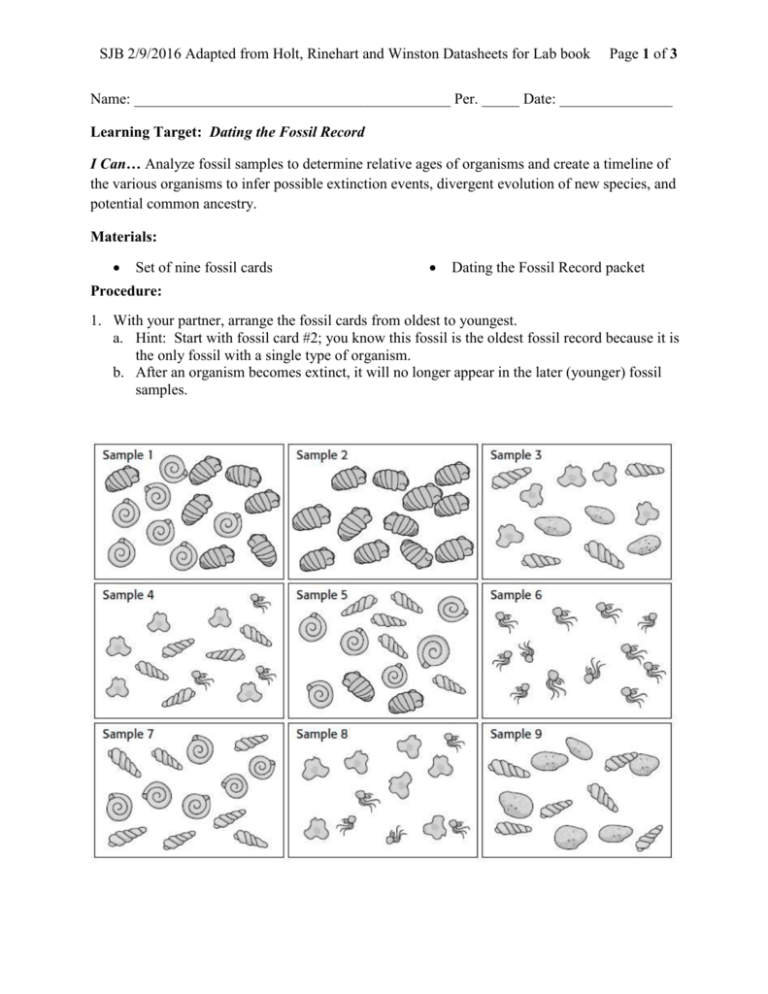
SJB 2/9/2016 Adapted from Holt, Rinehart and Winston Datasheets for Lab book Page 1 of 3 Name: __________________________________________ Per. _____ Date: _______________ Learning Target: Dating the Fossil Record I Can… Analyze fossil samples to determine relative ages of organisms and create a timeline of the various organisms to infer possible extinction events, divergent evolution of new species, and potential common ancestry. Materials: Set of nine fossil cards Dating the Fossil Record packet Procedure: 1. With your partner, arrange the fossil cards from oldest to youngest. a. Hint: Start with fossil card #2; you know this fossil is the oldest fossil record because it is the only fossil with a single type of organism. b. After an organism becomes extinct, it will no longer appear in the later (younger) fossil samples. SJB 2/9/2016 Adapted from Holt, Rinehart and Winston Datasheets for Lab book Page 2 of 3 2. In the table below, record your samples in order from oldest to youngest starting with fossil #2 on the bottom and work up the table. [Sample #2 is done for you] 3. Write the fossil names in order by age from left (oldest) to right (youngest) across the top row of the table. a. Drawing a representation of the fossil organism along with the name helps. b. Hint: Examine the fossil cards carefully to determine where each organism appears in the fossil record. 4. Place an “X” in the appropriate column to indicate which fossil organism or organisms are present in each sample. Name of Fossil Organism Table Order of Samples (Oldest – bottom, Youngest – top) Globus Slimus Sample #2 X Age of sample (millions of years ago) You are planning to prepare a timeline for the paleontologist who sent you the fossil samples. You have sent a piece of each rock sample to a geology lab to be radioisotope dated. When the results come back from the lab, you find that the dates and the samples have been separated and jumbled up. Since you have already determined the relative ages of the fossils, you can match the radioisotope dating of the samples with the samples in your table above. 5. Arrange the radioisotope ages from oldest (bottom) to youngest (top) in the Age of sample column. a. The ages of the samples determined by the geology lab are as follows: 28.5 mya, 30.2 mya, 18.3 mya, 17.6 mya, 26.3 mya, 14.2 mya, 23.1 mya, 15.5 mya, and 19.5 mya. SJB 2/9/2016 Adapted from Holt, Rinehart and Winston Datasheets for Lab book Page 3 of 3 Analysis Questions: Dating the Fossil Record 1. Analyze the location of the “X”s in the Fossil Table; is there a pattern to the position of the “X”s? 2. What might it mean if there was an “X” that was located outside the pattern? 3. What do you think “Relative” dating means? 4. Was the dating done by the geology laboratory a direct or indirect dating of the samples? Explain your reasoning. 5. What information can relative dating provide scientists about the fossil organisms? 6. Using the relative dating and the radioisotope dating, determine an age range for each organism. a. Globus slimus _________________________ b. Circus bozoensis _________________________ c. Bogus biggus _________________________ d. Microbius hairiensis _________________________ e. Fungus amongius _________________________ f. Bananabana bobana _________________________
