Tables Table 1. Characteristics, median with (5
advertisement
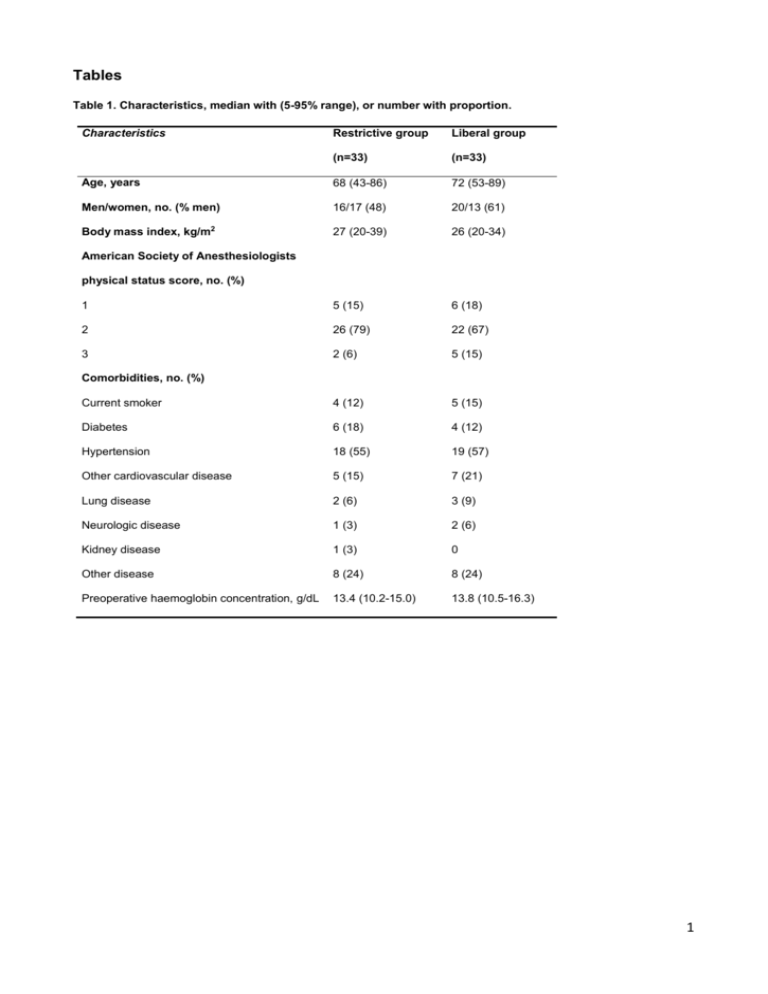
Tables Table 1. Characteristics, median with (5-95% range), or number with proportion. Restrictive group Liberal group (n=33) (n=33) Age, years 68 (43-86) 72 (53-89) Men/women, no. (% men) 16/17 (48) 20/13 (61) Body mass index, kg/m2 27 (20-39) 26 (20-34) 1 5 (15) 6 (18) 2 26 (79) 22 (67) 3 2 (6) 5 (15) Current smoker 4 (12) 5 (15) Diabetes 6 (18) 4 (12) Hypertension 18 (55) 19 (57) Other cardiovascular disease 5 (15) 7 (21) Lung disease 2 (6) 3 (9) Neurologic disease 1 (3) 2 (6) Kidney disease 1 (3) 0 Other disease 8 (24) 8 (24) Preoperative haemoglobin concentration, g/dL 13.4 (10.2-15.0) 13.8 (10.5-16.3) Characteristics American Society of Anesthesiologists physical status score, no. (%) Comorbidities, no. (%) 1 Table 2. Perioperative variables, median with (5-95% range), or number with proportion. Mean where indicated. Restrictive group Liberal group (n=30) (n=33) Total revision 13 (43) 15 (45.5) Acetabular component revision 9 (30) 15 (45.5) Femoral component revision 6 (20) 2 (6) Other 2 (7) 1 (3) General anesthesia 26 (87) 31 (94) Spinal anesthesia 4 (13) 2 (6) Femoral nerve block 2 (7) 1 (3) Local infiltration analgesia with catheter 2 (7) 1 (3) Local infiltration analgesia without catheter 8 (27) 10 (30) Epidural as postoperative pain management 11 (33) 17 (52) Blood loss during surgery, mL 575 (150-2300) 900 (200-2900) Urinary output during surgery, mL 340 (76-975) 300 (65-1000) Red Blood Cells 0 (0-490) 0 (0-980) Crystalloids 1500 (500-3500) 1500 (300-3100) Colloids 500 (0-1500) 750 (0-2000) Last Hb measured during surgery, g/dL 9.9 (6.5-12.8) 10.4 (8.3-12.9) Blood loss in drain if used, mL 150 (0-700) 150 (0-500) Urinary output during stay at PACU, mL 121 (49-190) 260 (45-1000) Transfusions of red blood cells in PACU, mL 0 (0-245) 0 (0-245) Crystalloids given in PACU, mL 700 (200-1200) 1000 (200-2400) Colloids given in PACU, mL 0 (0-500) 0 (0-500) Haemoglobin concentration at discharge from PACU, g/dL 9.9 (7.9-12.0) 10.2 (8.9-14.4) Crystalloids given, mL 0 (0-4000) 500 (0-4000) Colloids given, mL 0 (0-500) 0 (0-1500) Total perioperative transfusions of red blood cells, [mean], mL 0 [253] (0-1470) 245 [386] (0-1225) Total number of patients transfused, no. (%) 11 (37) 16 (48) Surgery Type of surgery, no. (%) Type of anesthesia, no. (%) Pain management, no. (%) Fluids given during surgery, mL1 Post Anaesthesia Care Unit (PACU)1 Postoperative period 2 Table 3. Indications for transfusions given by the attending physician not according to protocol. Restrictive group Liberal group (n=30) (n=33) Gastric bleeding 1 1 Fatigue 2 0 Dizziness 2 0 Pallor 2 0 Nausea 1 0 Dyspnoea 2 1 Atrial fibrillation 1 0 Other 0 1 3 Table 4. Postoperative complications. Restrictive group Liberal group (n=33) (n=33) 12 15 Pneumonia 0 4 Other pulmonary 1 3 Skin reaction 3 0 Fever 5 2 Dizziness/ discomfort 2 7 Hypotension 1 4 Fatigue 1 1 Hyperkalemia 1 1 Deep vein thrombosis 0 1 Surgical site infection 0 1 Fall at the ward or at home 3 4 Others 2 7 Gastrointestinal complications 4 Table 5. Functional outcomes and pain scores, median with (5-95% range), or number with proportion. Restrictive group Liberal group P value 36 (16-57) (n=25) 30 (23-87) (n=28) 0.02 1 5 5 0.87 2 8 9 3 3 3 4 2 5 ≥5 7 6 1 11 12 2 11 10 ≥3 4 7 Patients TUG tested with epidural catheter, 2 (8) (n=25) 4 (14) (n=28) VAS -score at rest* 0.5 (0-29) (n=24) 0 (0-48) (n=25) VAS-score at activity† 20.5 (0-67) (n=24) 22 (0-75) (n=25) Hb at the day of test, g/dL 10.2 (8.1-11.8) 9.9 (8.3-12.5) (n=23) (n=28) 8 (4-44) (n=33) 8 (4-38) (n=33) 12 (48) 14 (50) Crutches 11 (44) 11 (39) Zimmer frame 1 (4) 3 (11) Walking frame 6 (24) 3 (11) Highwalker 7 (28) 11 (39) Time for Timed Up and Go test, , seconds Postoperative day patients could perform TUG Postoperative day patients were able to walk 10 meters 0.93 no. (%) Pain score on the day of testing, Length of hospital stay after surgery, days 0.71 Allowed only partial weight bearing, no. (%) Type of walking aid, no. (%) 5
