function transformation handout
advertisement
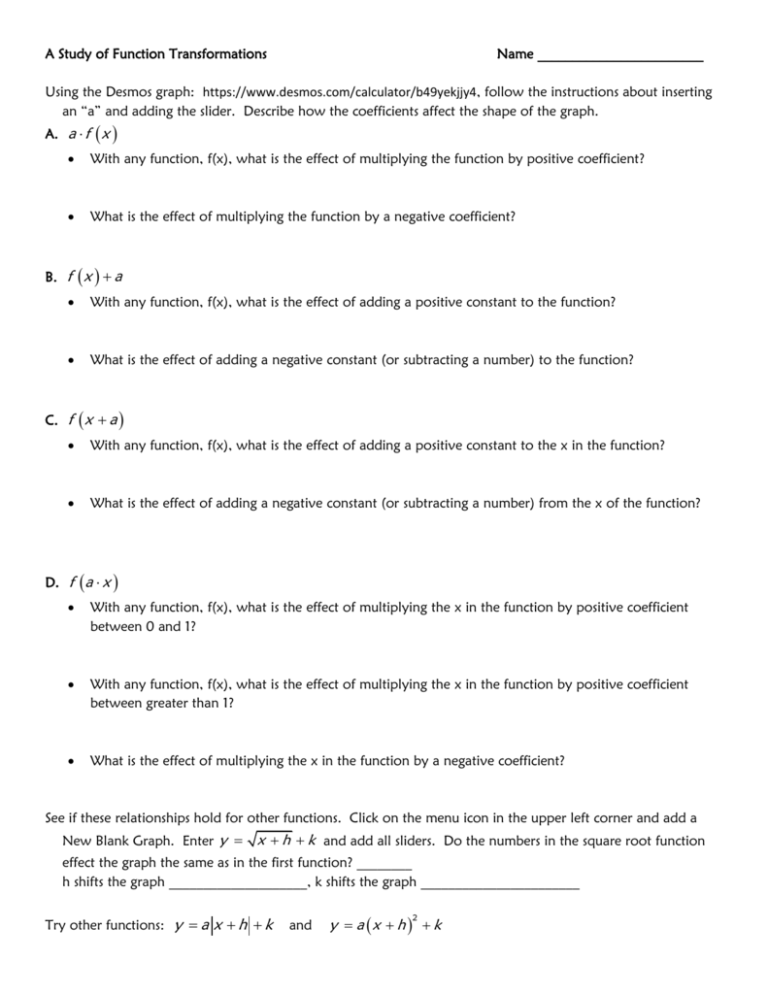
A Study of Function Transformations Name ________________________ Using the Desmos graph: https://www.desmos.com/calculator/b49yekjjy4, follow the instructions about inserting an “a” and adding the slider. Describe how the coefficients affect the shape of the graph. A. a f x With any function, f(x), what is the effect of multiplying the function by positive coefficient? What is the effect of multiplying the function by a negative coefficient? B. f x a With any function, f(x), what is the effect of adding a positive constant to the function? What is the effect of adding a negative constant (or subtracting a number) to the function? C. f x a With any function, f(x), what is the effect of adding a positive constant to the x in the function? What is the effect of adding a negative constant (or subtracting a number) from the x of the function? D. f a x With any function, f(x), what is the effect of multiplying the x in the function by positive coefficient between 0 and 1? With any function, f(x), what is the effect of multiplying the x in the function by positive coefficient between greater than 1? What is the effect of multiplying the x in the function by a negative coefficient? See if these relationships hold for other functions. Click on the menu icon in the upper left corner and add a New Blank Graph. Enter y x h k and add all sliders. Do the numbers in the square root function effect the graph the same as in the first function? ________ h shifts the graph ____________________, k shifts the graph _______________________ Try other functions: y a x h k and y a x h k 2 How do coefficients and constants affect trigonometric graphs? You can start with a new blank graph again. Enter the parent function sin(x) in one line and then f x a sin b x c d in another line. It will be helpful to only adjust one slider at a time and always return to the parent function settings which are A=1 B=1 C=0 D=0 f x 1sin 1x 0 0 What does a effect in the graph? _________________________________________________________________ What does b control? __________________________________________________________________________ What does c control? ___________________________________________________________________________ What does d control? ___________________________________________________________________________ Go to wsfcs.k12.nc.us/jriggins and click on Math III on the left. Scroll down to the bottom of that page and click on Trig data to model. Copy the data for NC Temperature and paste in a blank line in the desmos graphing page. Using the sliders and what you have learned about the coefficients a, b, c, and d try to build a sine function to model this data. To help us be consistent, let’s keep A and B both positive. _______________________________________ Copy the data for ND Temperature and paste it into a blank line in the desmos screen. This time DO NOT use the sliders. Type in what coefficients you think will model the data and adjust them as needed to fit the data. _______________________________________ What does the difference in the amplitude (the “a” coefficient) of the two models tell you about the temperatures in North Carolina and North Dakota? ____________________________________________________________________________________________ What does the difference in the vertical shift (the “d” constant) of the two models tell you about the temperatures in North Carolina and North Dakota? ____________________________________________________________________________________________ The “b” coefficient controls the length of the cycle. Since the length of our cycle is 12 months we would use the equation 2 b 12 . Solving for b you would get b 6 , or approximately .5 The horizontal shift of the sine function is right 4 months (the average temp in April is the average yearly temp or the midline), Thus solving .5(4) c 0 for c we get -2 for the c coefficient.

