HW1 Problem Set 1 Supply and Demand Part 1: Perloff Chapter 2
HW1
Problem Set 1 Supply and Demand
Part 1: Perloff Chapter 2: Q6 and Q9
Part2: Shocking the Equilibrium: Comparative Static
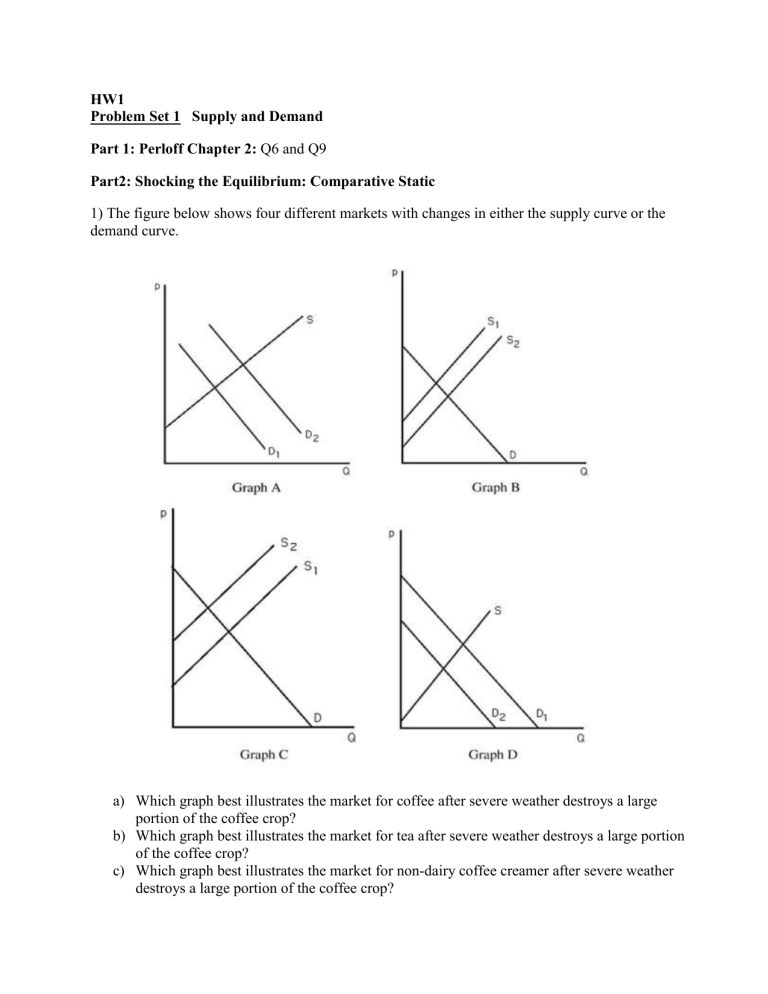
1) The figure below shows four different markets with changes in either the supply curve or the demand curve.
a) Which graph best illustrates the market for coffee after severe weather destroys a large portion of the coffee crop? b) Which graph best illustrates the market for tea after severe weather destroys a large portion of the coffee crop? c) Which graph best illustrates the market for non-dairy coffee creamer after severe weather destroys a large portion of the coffee crop?
d) Which graph best illustrates the market for computers after technological advances in making computers occur? e) Which graph best illustrates the market for computer manuals after technological advances in making computers occur? f) Which graph best illustrates the market for typewriters after technological advances in computerized word-processing software occur?
2) Suppose that the supply and demand of wheat depend on the price of wheat ( p ), the amount of annual rainfall ( r ), and the level of disposable consumer income ( I ). The equations describing the supply and demand curves are given by:
QS=20r+100p
QD=4000-100p+10I
Sketch a graph of the supply and demand curves for wheat and show the effects of an increase in the quantity of rainfall. How does each curve shift (if at all) from the increase in rainfall? What does this shift do to the equilibrium price and quantity (increase/decrease)?
3) Using the supply and demand curve for wheat above, sketch the supply and demand curves demonstrating the effect of an increase in disposable consumer incomes. How does each curve shift (if at all) to the increase in income? What does the shift do to equilibrium price and quantity?
4) Using the supply and demand equations for wheat, solve for the equilibrium price and quantity as functions of I and r .
5) Using the supply and demand equations for wheat above, determine how the equilibrium price and quantity vary with an increase in rainfall( r ) holding other factors that influence supply and demand fixed. How do the equilibrium price and quantity change with an increase in income( I ).
Answer this comparative statics question using calculus.
6) An article about the market for marijuana made the following three observations: (a) In
1991, the price was $80 an ounce; several years earlier the price was $30 an ounce. (b) By
1991, marijuana smoking was no longer in vogue – “the great marijuana could has grown wispy… as health concerns… have risen above the desire had turned marijuana into a
“scarce commodity” (Treaster 1991, A.1). Draw a set of supply and demand curves that are capable of reconciling these observations.
Problem Set 2 Elasticities
Part 1: Perloff Chapter 2: Q16
Part2: Elasticities
1) The price elasticity of demand for gasoline is estimated to be -0.2. Two million gallons are sold daily at a price of $1. Use this information to calculate a demand curve for gasoline assuming it is linear.
2) Suppose that the long-run world demand and supply elasticities of crude oil are -0.906 and
0.515, respectively. The current long-run equilibrium price is $30 per barrel and the equilibrium quantity is 16.88 billion barrels per year. a.
Derive the (linear) long-run demand and supply equations. b.
Suppose the long-run supply curve you derived above consists of competitive supply plus the quantity of OPEC supply. If the long-run competitive supply (not including OPEC’s production) is:
QS = 7.78 + 0.29
p , what must be OPEC ʹ s level of production in this long-run equilibrium to maintain the price of $30?
3) Suppose that the current price of oil is $60 per barrel and the quantity sold is 90 million barrels per day. The current estimates of the price elasticity of supply and demand are η=1 and ε=-.2 respectively. a.
Compute linear equations for the supply and demand. b.
What will be the effects on the market price and quantity if the U.S. government suddenly decides to purchase an additional 2 million barrels of oil? Assume that the addition consumption of oil by the government results in a parallel shift of the supply curve to the left by 2 million barrels per day.
4) Show that the supply function Q Ap has constant elasticity.
5) The National Association of Business Schools recently required that all business schools must hire three additional people with Ph.D. degrees in English literature. What is the immediate effect on the salaries of people with Ph.D.s in English literature? What will be the effect after ten years?

