The population of rabbits is given by the differential equation where
advertisement
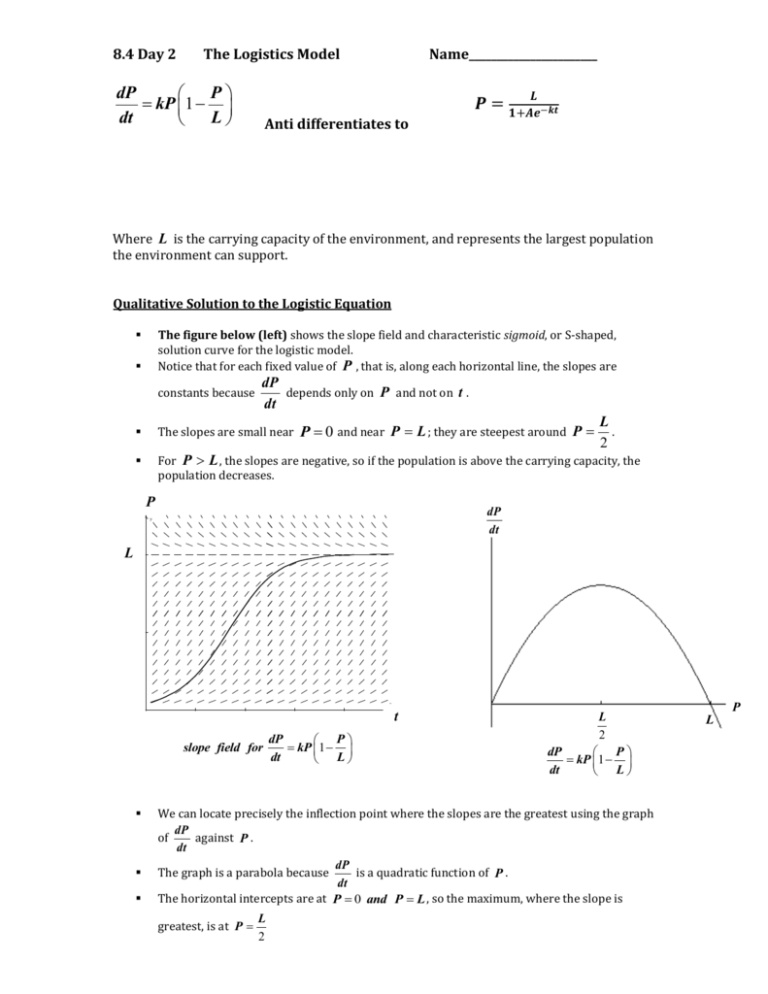
8.4 Day 2 The Logistics Model dP P kP 1 dt L Name_______________________ 𝑳 Anti differentiates to 𝑷 = 𝟏+𝑨𝒆−𝒌𝒕 Where L is the carrying capacity of the environment, and represents the largest population the environment can support. Qualitative Solution to the Logistic Equation The figure below (left) shows the slope field and characteristic sigmoid, or S-shaped, solution curve for the logistic model. Notice that for each fixed value of P , that is, along each horizontal line, the slopes are constants because dP depends only on P and not on t . dt P 0 and near P L ; they are steepest around P L . 2 The slopes are small near For P L , the slopes are negative, so if the population is above the carrying capacity, the population decreases. P dP dt y L x slope field for dP P kP 1 dt L t L 2 dP P kP 1 dt L We can locate precisely the inflection point where the slopes are the greatest using the graph dP of against P . dt dP The graph is a parabola because is a quadratic function of P . dt The horizontal intercepts are at P 0 and P L , so the maximum, where the slope is greatest, is at P L 2 P L A population is modeled by the function P that satisfies the 𝒅𝑷 𝑷 𝑷 logistics differential equation = (𝟏 − ) 𝒅𝒕 𝟓 𝟏𝟐 1. If P(0)=3, find lim 𝑃(𝑡) 𝑡→∞ 2. If P(0)=20, find lim 𝑃(𝑡) 𝑡→∞ 3. If P(0)=3, for what value of P is the population growing the fastest? A different population is modeled by a function Y that satisfies the 𝒅𝒀 𝒀 𝒕 separable differential equation = (𝟏 − ). where y(0)=3 𝒅𝒕 4. Find Y(t) given Y(0) =3 5. Find lim 𝑌 𝑡→∞ 𝟓 𝟏𝟐 The population of rabbits is given by the differential equation 𝑷 𝑷′ (𝒕) =. 𝟐𝑷(𝟏 − ) where P(0)=50. 𝟏𝟐𝟎𝟎 6. Find the equilibrium solutions. 7. Find the population equation. 8. What is the carrying capacity of the population? 9. What is the population when the growth rate is at a maximum? 10. For what positive values of P is the solution curve concave up? The number of wild burros in Arizona was as low as 500 in 2013. Biologists believe that the population P satisfies differential equation 𝒅𝑷 𝟏 = (𝟏𝟎𝟎𝟎 − 𝑷). 𝒅𝒕 𝟐 11. Is the burro population growing faster when there are 600 burros or 800 burros? 12. Use the tangent line to the graph of P at t = 0 to approximate the number of burros in 2014. 𝑑2𝑃 13. Find 2 in terms of P and use it to determine if your estimate 𝑑𝑡 above is an over or under estimate. 14. Find P(t) 15. Find lim 𝑃(𝑡) 𝑡→∞
