Supporting Information Table S1. Primers designed for real
advertisement

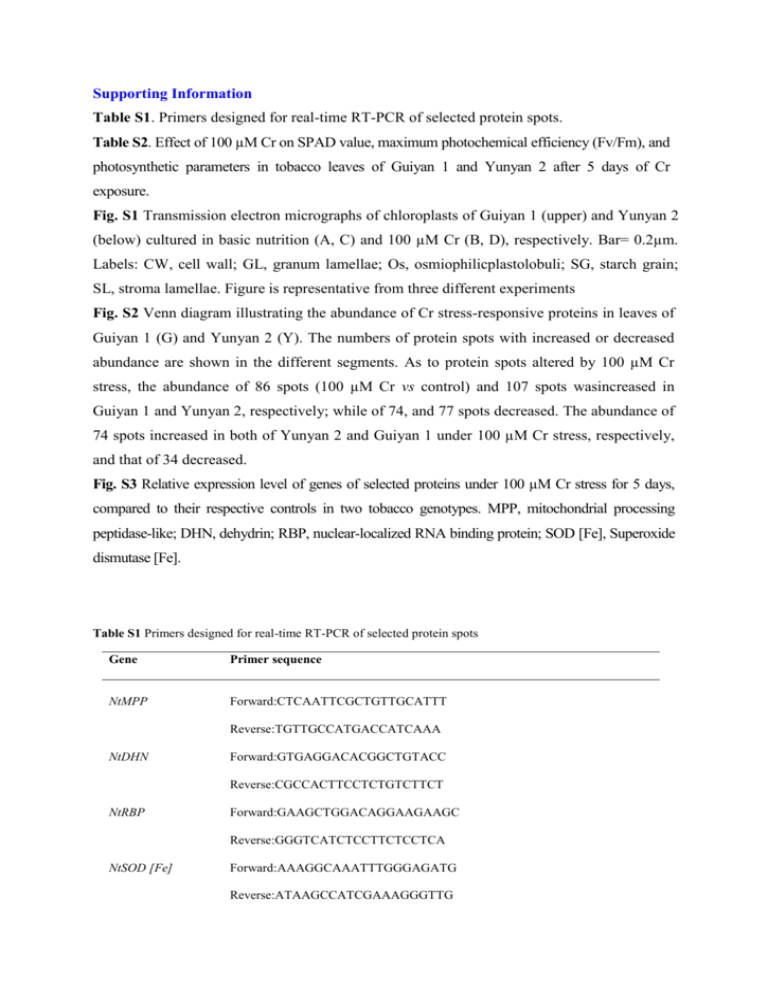
Supporting Information Table S1. Primers designed for real-time RT-PCR of selected protein spots. Table S2. Effect of 100 µM Cr on SPAD value, maximum photochemical efficiency (Fv/Fm), and photosynthetic parameters in tobacco leaves of Guiyan 1 and Yunyan 2 after 5 days of Cr exposure. Fig. S1 Transmission electron micrographs of chloroplasts of Guiyan 1 (upper) and Yunyan 2 (below) cultured in basic nutrition (A, C) and 100 µM Cr (B, D), respectively. Bar= 0.2µm. Labels: CW, cell wall; GL, granum lamellae; Os, osmiophilicplastolobuli; SG, starch grain; SL, stroma lamellae. Figure is representative from three different experiments Fig. S2 Venn diagram illustrating the abundance of Cr stress-responsive proteins in leaves of Guiyan 1 (G) and Yunyan 2 (Y). The numbers of protein spots with increased or decreased abundance are shown in the different segments. As to protein spots altered by 100 µM Cr stress, the abundance of 86 spots (100 µM Cr vs control) and 107 spots wasincreased in Guiyan 1 and Yunyan 2, respectively; while of 74, and 77 spots decreased. The abundance of 74 spots increased in both of Yunyan 2 and Guiyan 1 under 100 µM Cr stress, respectively, and that of 34 decreased. Fig. S3 Relative expression level of genes of selected proteins under 100 µM Cr stress for 5 days, compared to their respective controls in two tobacco genotypes. MPP, mitochondrial processing peptidase-like; DHN, dehydrin; RBP, nuclear-localized RNA binding protein; SOD [Fe], Superoxide dismutase [Fe]. Table S1 Primers designed for real-time RT-PCR of selected protein spots Gene Primer sequence NtMPP Forward:CTCAATTCGCTGTTGCATTT Reverse:TGTTGCCATGACCATCAAA NtDHN Forward:GTGAGGACACGGCTGTACC Reverse:CGCCACTTCCTCTGTCTTCT NtRBP Forward:GAAGCTGGACAGGAAGAAGC Reverse:GGGTCATCTCCTTCTCCTCA NtSOD [Fe] Forward:AAAGGCAAATTTGGGAGATG Reverse:ATAAGCCATCGAAAGGGTTG β-actin Forward: TTGACGGAAAGAGGTTAT Reverse: GTTGGAAGGTGCTGAGAG Table S2. Effect of 100 µM Cr on SPAD value, maximum photochemical efficiency (Fv/Fm), and photosynthetic parameters in tobacco leaves of Guiyan 1 and Yunyan 2 after 5 days of Cr exposure. Treatment SPAD value Fv/Fm Pn Tr Gs (µmol (mmol H2O m- (mmol H2O·m2 -1 2 -1 CO2·m−2·s−1) ·s ) ·s ) Ci (µl CO2·L-1) Guiyan 1 42.5 a 0.799 a 17.12 a 4.32 a 0.312 a 245.54 a 32.07 b 0.661 b 10.73 b 2.88 b 0.169 b 166.67 b (24.5) (17.3) (37.3) (33.3) (45.8) (32.1) Yunyan 2 Control 42.20 a 0.778 a 17.69 a 4.17 a 0.286 a 240.31 a Cr 24.8 c 0.544 c 7.26 c 1.45 c 0.112 c 125.36 c (41.2) (30.1) ( 59.0) (65.2) (60.8) (47.8) Different letters indicate significant differences (P<0.05) among each treatment within two genotypes. Values in parenthesis are the reduced percentage over the control. Pn, net photosynthetic rate; Tr, transpiration rate; Gs, stomatal conductance; Ci, intercellular CO2 concentration. Control Cr Fig. S1 Transmission electron micrographs of chloroplasts of Guiyan 1 (upper) and Yunyan 2 (below) cultured in basic nutrition (A, C) and 100 µM Cr (B, D), respectively. Bar= 0.2µm. Labels: CW, cell wall; GL, granum lamellae; Os, osmiophilicplastolobuli; SG, starch grain; SL, stroma lamellae. Figure is representative from three different experiments. G-down Y-down Y-up 95 12 34 43 28 Y-constant 239 G-constant Y-up 21 1 86 Y-down 76 192 Y-constant 75 G-up Y-up 74 4 33 Y-down 73 8 Y-constant 259 Fig. S2 Venn diagram illustrating the abundance of Cr stress-responsive proteins in leaves of Guiyan 1 (G) and Yunyan 2 (Y). The numbers of protein spots with increased- or decreased abundance are shown in the different segments. As to protein spots altered by 100 µM Cr stress, the abundance of 86 spots (100 µM Cr vs control) and 107 spots wasincreased in Guiyan 1 and Yunyan 2, respectively; while of 74, and 77 spots decreased. The abundance of 74 spots increased in both of Yunyan 2 and Guiyan 1 under 100 µM Cr stress, respectively, and that of 34 decreased. Fig. S3 Relative expression level of genes of selected proteins under 100 µM Cr stress for 5 days, compared to their respective controls in two tobacco genotypesof Guiyan 1 (G) and Yunyan 2 (Y). MPP, mitochondrial processing peptidase-like; DHN, dehydrin; RBP, nuclear-localized RNA binding protein; SOD [Fe], Superoxide dismutase [Fe].


