Intensive oyster aquaculture bmp technical appendix
advertisement
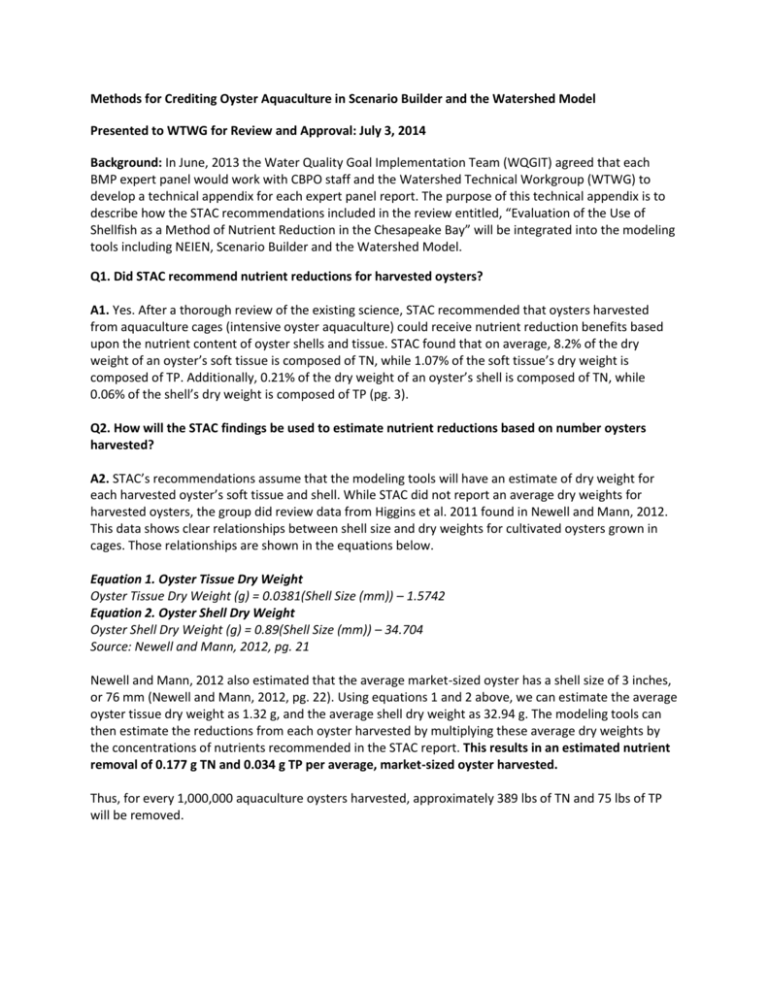
Methods for Crediting Oyster Aquaculture in Scenario Builder and the Watershed Model Presented to WTWG for Review and Approval: July 3, 2014 Background: In June, 2013 the Water Quality Goal Implementation Team (WQGIT) agreed that each BMP expert panel would work with CBPO staff and the Watershed Technical Workgroup (WTWG) to develop a technical appendix for each expert panel report. The purpose of this technical appendix is to describe how the STAC recommendations included in the review entitled, “Evaluation of the Use of Shellfish as a Method of Nutrient Reduction in the Chesapeake Bay” will be integrated into the modeling tools including NEIEN, Scenario Builder and the Watershed Model. Q1. Did STAC recommend nutrient reductions for harvested oysters? A1. Yes. After a thorough review of the existing science, STAC recommended that oysters harvested from aquaculture cages (intensive oyster aquaculture) could receive nutrient reduction benefits based upon the nutrient content of oyster shells and tissue. STAC found that on average, 8.2% of the dry weight of an oyster’s soft tissue is composed of TN, while 1.07% of the soft tissue’s dry weight is composed of TP. Additionally, 0.21% of the dry weight of an oyster’s shell is composed of TN, while 0.06% of the shell’s dry weight is composed of TP (pg. 3). Q2. How will the STAC findings be used to estimate nutrient reductions based on number oysters harvested? A2. STAC’s recommendations assume that the modeling tools will have an estimate of dry weight for each harvested oyster’s soft tissue and shell. While STAC did not report an average dry weights for harvested oysters, the group did review data from Higgins et al. 2011 found in Newell and Mann, 2012. This data shows clear relationships between shell size and dry weights for cultivated oysters grown in cages. Those relationships are shown in the equations below. Equation 1. Oyster Tissue Dry Weight Oyster Tissue Dry Weight (g) = 0.0381(Shell Size (mm)) – 1.5742 Equation 2. Oyster Shell Dry Weight Oyster Shell Dry Weight (g) = 0.89(Shell Size (mm)) – 34.704 Source: Newell and Mann, 2012, pg. 21 Newell and Mann, 2012 also estimated that the average market-sized oyster has a shell size of 3 inches, or 76 mm (Newell and Mann, 2012, pg. 22). Using equations 1 and 2 above, we can estimate the average oyster tissue dry weight as 1.32 g, and the average shell dry weight as 32.94 g. The modeling tools can then estimate the reductions from each oyster harvested by multiplying these average dry weights by the concentrations of nutrients recommended in the STAC report. This results in an estimated nutrient removal of 0.177 g TN and 0.034 g TP per average, market-sized oyster harvested. Thus, for every 1,000,000 aquaculture oysters harvested, approximately 389 lbs of TN and 75 lbs of TP will be removed. Q3. What do jurisdictions need to report to NEIEN in order to receive credit for oyster aquaculture? A3. Jurisdictions should report the following BMP Name: Oyster Aquaculture Measurement Name: Number (Oysters Harvested) Land Use: N/A; this BMP will be simulated adjacent to or within tidal waters. Location: Approved NEIEN geographies: Latitude/Longitude (preferred);County; County (CBWS Only); Hydrologic Unit Code (HUC12, HUC10, HUC8, HUC6, HUC4), State (CBWS Only) Date of Harvest: year the oysters were harvested Q4. Can jurisdictions receive reductions for extensive oyster aquaculture or natural oyster reef restoration? Q4. Not at this time. STAC reviewed the available science and determined that only intensive, oyster aquaculture was appropriate for crediting purposes (pg. 5). Q5. Is there a credit for denitrification that may occur at oyster aquaculture sites? Q5. Not at this time. STAC determined that further research is needed before reliable estimates of nitrogen removal via denitrification are used for credit in the modeling tools (pg. 10). Q6. What if a producer grows oysters larger or smaller than 76 mm? Q6. The producer may choose to submit the average size of his or her oysters in addition to the requirements listed above. Equations 1 and 2 above will again be used to estimate average dry weight and tissue weight. Alternatively, a producer may also collect dry weight samples of his or her oysters and report the average dry weights to the Chesapeake Bay Program. Please contact the CBP Modeling Team if you wish to submit the data in this way so that appropriate changes can be made to the NEIEN system. Q7. How will the modeling tools estimate the actual load reductions from each aquaculture operation? A7. Scenario Builder will simulate the load reductions at the edge-of-stream, similar to those reductions simulated for point sources. These reductions will be associated with a land-river segment, but also with a water quality modeling cell so that loads may be reduced in the appropriate tidal segment. Q8. Is this BMP an annual or cumulative practice? A8. Oyster Aquaculture will be credited as an annual practice. This means that jurisdictions should report all measurement names to NEIEN for each year oysters are harvested. Sources: STAC, 2013. “Evaluation of the Use of Shellfish as a Method of Nutrient Reduction in the Chesapeake Bay: A response to the request from the Management Board of the Chesapeake Bay Program.” STAC. Edgewater, MD. September, 2013. Newell, R. and Mann, R. 2012. “Shellfish Aquaculture: Ecosystem Effects, Benthic-Pelagic Coupling and Potential for Nutrient Trading.” Gloucester Point, VA. June, 2012.
