Grade 6 Mathematics Module 1, Topic B, Lesson 12
advertisement
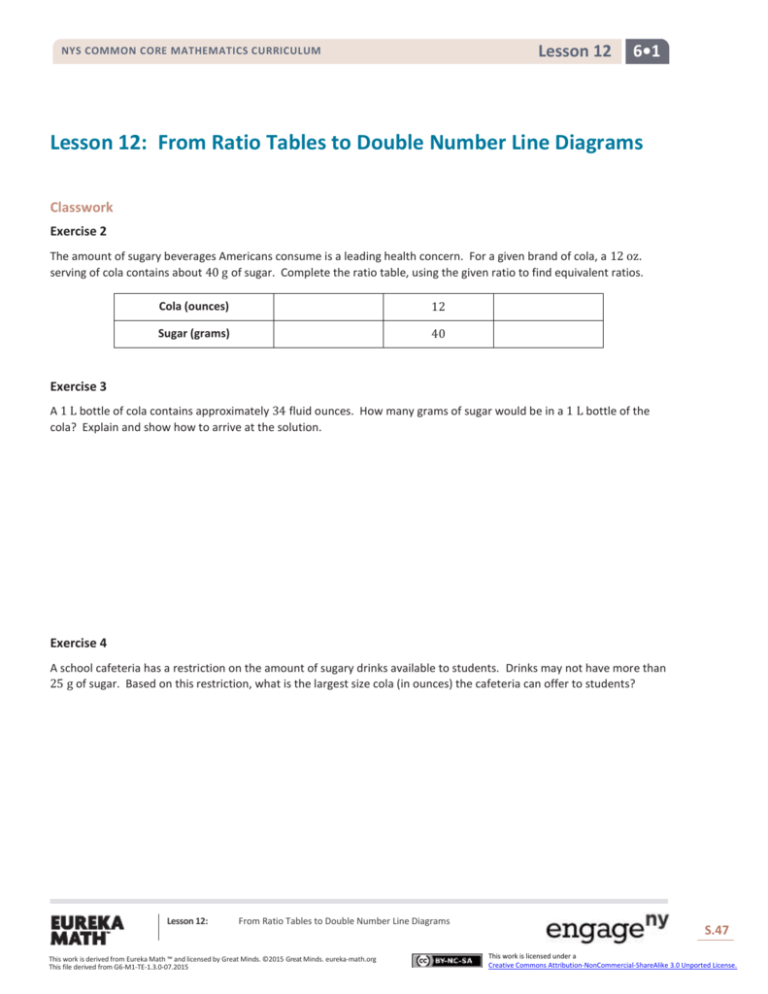
Lesson 12 NYS COMMON CORE MATHEMATICS CURRICULUM 6•1 Lesson 12: From Ratio Tables to Double Number Line Diagrams Classwork Exercise 2 The amount of sugary beverages Americans consume is a leading health concern. For a given brand of cola, a 12 oz. serving of cola contains about 40 g of sugar. Complete the ratio table, using the given ratio to find equivalent ratios. Cola (ounces) 12 Sugar (grams) 40 Exercise 3 A 1 L bottle of cola contains approximately 34 fluid ounces. How many grams of sugar would be in a 1 L bottle of the cola? Explain and show how to arrive at the solution. Exercise 4 A school cafeteria has a restriction on the amount of sugary drinks available to students. Drinks may not have more than 25 g of sugar. Based on this restriction, what is the largest size cola (in ounces) the cafeteria can offer to students? Lesson 12: From Ratio Tables to Double Number Line Diagrams This work is derived from Eureka Math ™ and licensed by Great Minds. ©2015 Great Minds. eureka-math.org This file derived from G6-M1-TE-1.3.0-07.2015 S.47 This work is licensed under a Creative Commons Attribution-NonCommercial-ShareAlike 3.0 Unported License. Lesson 12 NYS COMMON CORE MATHEMATICS CURRICULUM 6•1 Exercise 5 Shontelle solves three math problems in four minutes. a. Use this information to complete the table below. Number of Questions 3 6 9 12 15 18 21 24 27 30 Number of Minutes b. Shontelle has soccer practice on Thursday evening. She has a half hour before practice to work on her math homework and to talk to her friends. She has 20 math skill-work questions for homework, and she wants to complete them before talking with her friends. How many minutes will Shontelle have left after completing her math homework to talk to her friends? Use a double number line diagram to support your answer, and show all work. Lesson 12: From Ratio Tables to Double Number Line Diagrams This work is derived from Eureka Math ™ and licensed by Great Minds. ©2015 Great Minds. eureka-math.org This file derived from G6-M1-TE-1.3.0-07.2015 S.48 This work is licensed under a Creative Commons Attribution-NonCommercial-ShareAlike 3.0 Unported License. NYS COMMON CORE MATHEMATICS CURRICULUM Lesson 12 6•1 Lesson Summary A double number line is a representation of a ratio relationship using a pair of parallel number lines. One number line is drawn above the other so that the zeros of each number line are aligned directly with each other. Each ratio in a ratio relationship is represented on the double number line by always plotting the first entry of the ratio on one of the number lines and plotting the second entry on the other number line so that the second entry is aligned with the first entry. Problem Set 1. While shopping, Kyla found a dress that she would like to purchase, but it costs $52.25 more than she has. Kyla charges $5.50 an hour for babysitting. She wants to figure out how many hours she must babysit to earn $52.25 to buy the dress. Use a double number line to support your answer. 2. Frank has been driving at a constant speed for 3 hours, during which time he traveled 195 miles. Frank would like to know how long it will take him to complete the remaining 455 miles, assuming he maintains the same constant speed. Help Frank determine how long the remainder of the trip will take. Include a table or diagram to support your answer. Lesson 12: From Ratio Tables to Double Number Line Diagrams This work is derived from Eureka Math ™ and licensed by Great Minds. ©2015 Great Minds. eureka-math.org This file derived from G6-M1-TE-1.3.0-07.2015 S.49 This work is licensed under a Creative Commons Attribution-NonCommercial-ShareAlike 3.0 Unported License.
