photosynthesis lab - Helena High School
advertisement
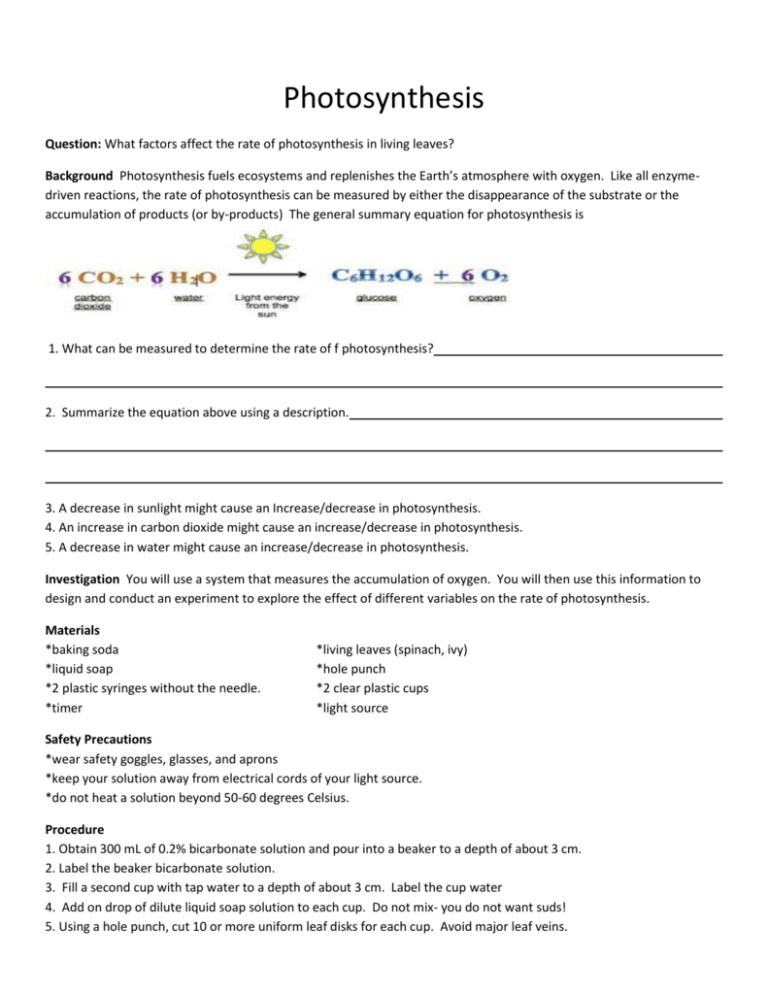
Photosynthesis Question: What factors affect the rate of photosynthesis in living leaves? Background Photosynthesis fuels ecosystems and replenishes the Earth’s atmosphere with oxygen. Like all enzymedriven reactions, the rate of photosynthesis can be measured by either the disappearance of the substrate or the accumulation of products (or by-products) The general summary equation for photosynthesis is 1. What can be measured to determine the rate of f photosynthesis? 2. Summarize the equation above using a description. 3. A decrease in sunlight might cause an Increase/decrease in photosynthesis. 4. An increase in carbon dioxide might cause an increase/decrease in photosynthesis. 5. A decrease in water might cause an increase/decrease in photosynthesis. Investigation You will use a system that measures the accumulation of oxygen. You will then use this information to design and conduct an experiment to explore the effect of different variables on the rate of photosynthesis. Materials *baking soda *liquid soap *2 plastic syringes without the needle. *timer *living leaves (spinach, ivy) *hole punch *2 clear plastic cups *light source Safety Precautions *wear safety goggles, glasses, and aprons *keep your solution away from electrical cords of your light source. *do not heat a solution beyond 50-60 degrees Celsius. Procedure 1. Obtain 300 mL of 0.2% bicarbonate solution and pour into a beaker to a depth of about 3 cm. 2. Label the beaker bicarbonate solution. 3. Fill a second cup with tap water to a depth of about 3 cm. Label the cup water 4. Add on drop of dilute liquid soap solution to each cup. Do not mix- you do not want suds! 5. Using a hole punch, cut 10 or more uniform leaf disks for each cup. Avoid major leaf veins. Note: When immersed in water, oxygen bubbles are usually trapped in the air spaces of the spongy mesophyll in the plant leaf. If these bubbles are not released, the leaf disks will float skewing results. A vacuum can be created using a syringe to pull out the oxygen from the mesophyll in order to measure the rate of photosynthesis. 6. Remove the plunger or piston from both syringes. Place the 10 leaf disks into each syringe barrel. 7. Replace the plunger-be careful not to crush the leaf disks. Push in the plunger until only a small volume of air and leaf disk remains in the barrel (<10%) 8. Pull a small volume (5 cubic centimeters (cc) of sodium bicarbonate plus soap solution from your prepared beaker into one syringe and a small volume of water plus soap into the other syringe. Be careful not to make suds. 9. Tap each syringe to suspend the leaf disks in solution. Make sure that, with the plunger inverted, the disks are suspended in the solution. Make sure no air remains. Move the plunger to get rid of air from the plunger before attempting step 10. 10. Create a vacuum: This step may need to be done 2 or 3 times. Hold a finger over the narrow syringe opening while drawing back the plunger. Hold the vacuum for about 10 seconds. While holding the vacuum, swirl the leaf disk to suspend them in the solution. Now release the vacuum by letting the plunger spring back. The solution will infiltrate the air spaces in the leaf disk, causing the leaf disk to sink in the syringe. If the plunger does not spring back a good vacuum was not created. Repeat again until a good vacuum is made. Write a hypothesis- what variable was changed? Use an if/then statement. Experimental Group Independent Variable Control Variables Control Group: Dependent variable 11. Create a data table below. Remember your table needs to be neat (ruler), have a title, and be well organized. For this table you will be recording the number of disks floating each minute until they are all floating. 12. Once a good vacuum is made, pour the disks and the solution from the syringe back into the appropriate beaker. 13. Place both cups under the light source and start the timer. At the end of each minute, record the number of floating disks. Then swirl the disks to dislodge any that stuck against the side of the cup. Continue until all the disks are floating. Questions: Why are the discs floating after time elapses? Data Table: Questions 1. What beaker showed the greatest rate of photosynthesis? 2. Describe the evidence supporting the above conclusion. 3. Create a graph – Remember Tails – T-Title A-Axis, I-interval, L-labels, S-Scale/ The dependent variable is on the y axis – remember to label and the independent variable is on the x axis. Graph Design your own experiment following the general procedures from this lab 1. Look at the equation for photosynthesis and copy it down on a separate sheet of paper. 2. List of variables that could influence the rate of photosynthesis 3. Write a hypothesis, experimental group, control group, independent variable, dependent variable, and control variables. 4. Create a table to record data 5. Carry out the experiment 6. Summarize the data – just explain data 7. Accept or reject hypothesis 8. Graph – follow tails
