Table S1. Relative volume calculation in Cp183RNA
advertisement
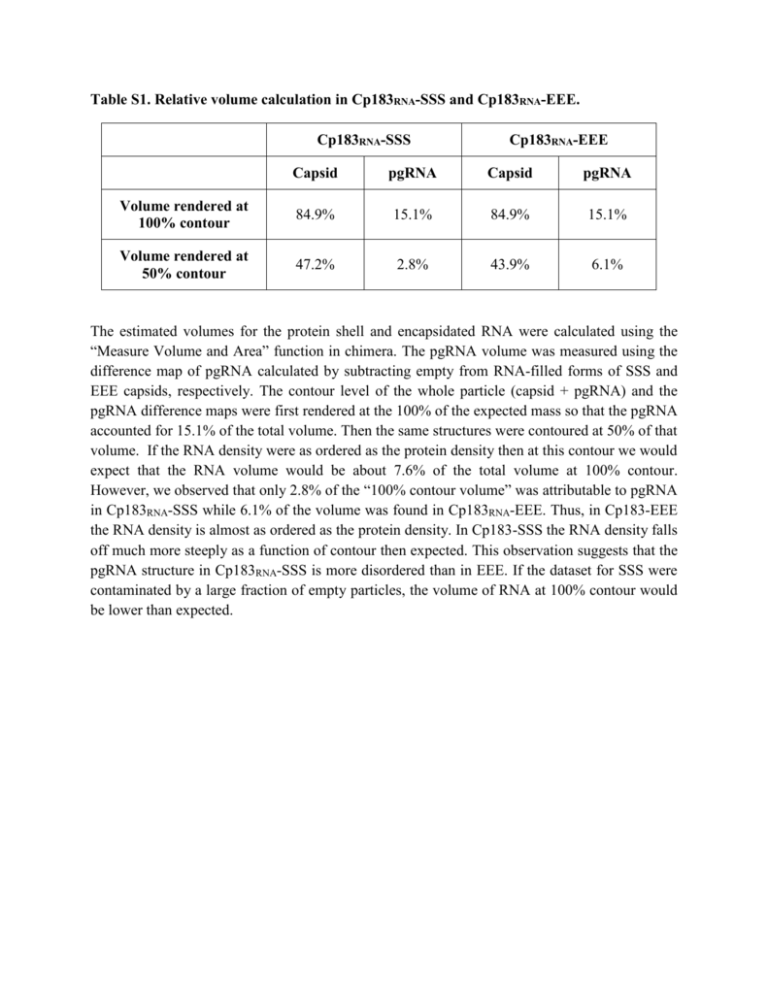
Table S1. Relative volume calculation in Cp183RNA-SSS and Cp183RNA-EEE. Cp183RNA-SSS Cp183RNA-EEE Capsid pgRNA Capsid pgRNA Volume rendered at 100% contour 84.9% 15.1% 84.9% 15.1% Volume rendered at 50% contour 47.2% 2.8% 43.9% 6.1% The estimated volumes for the protein shell and encapsidated RNA were calculated using the “Measure Volume and Area” function in chimera. The pgRNA volume was measured using the difference map of pgRNA calculated by subtracting empty from RNA-filled forms of SSS and EEE capsids, respectively. The contour level of the whole particle (capsid + pgRNA) and the pgRNA difference maps were first rendered at the 100% of the expected mass so that the pgRNA accounted for 15.1% of the total volume. Then the same structures were contoured at 50% of that volume. If the RNA density were as ordered as the protein density then at this contour we would expect that the RNA volume would be about 7.6% of the total volume at 100% contour. However, we observed that only 2.8% of the “100% contour volume” was attributable to pgRNA in Cp183RNA-SSS while 6.1% of the volume was found in Cp183RNA-EEE. Thus, in Cp183-EEE the RNA density is almost as ordered as the protein density. In Cp183-SSS the RNA density falls off much more steeply as a function of contour then expected. This observation suggests that the pgRNA structure in Cp183RNA-SSS is more disordered than in EEE. If the dataset for SSS were contaminated by a large fraction of empty particles, the volume of RNA at 100% contour would be lower than expected.


