Algebra 1 Mid term review Answer Section
Algebra 1 Mid term review
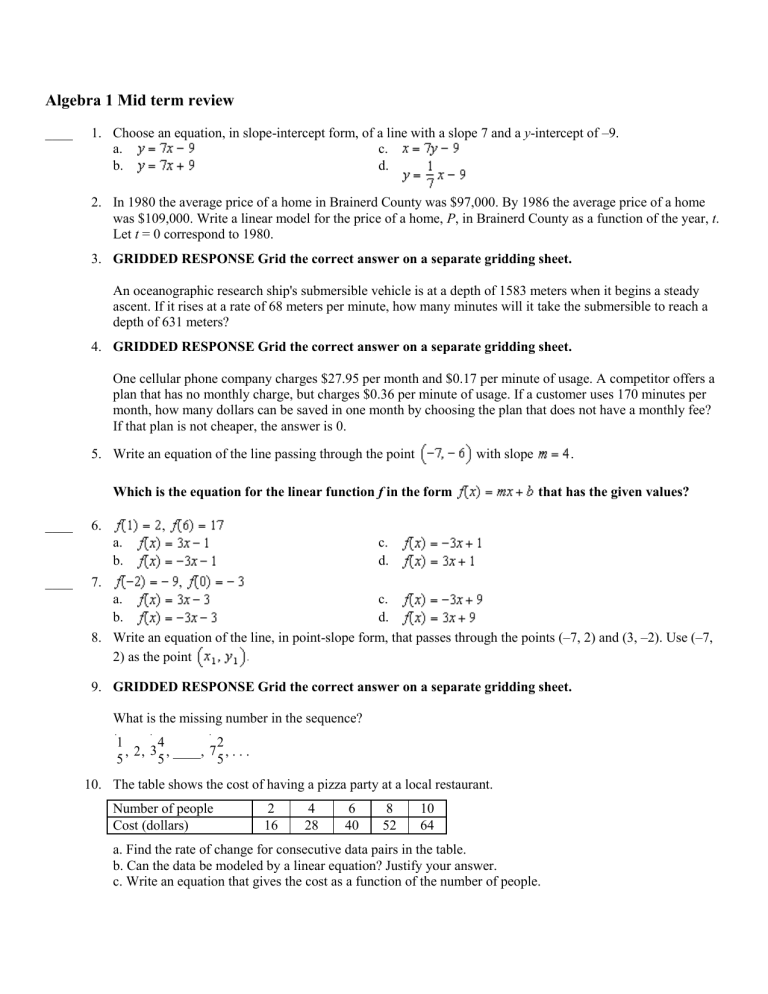
____ 1. Choose an equation, in slope-intercept form, of a line with a slope 7 and a y -intercept of –9. a. c. b. d.
2. In 1980 the average price of a home in Brainerd County was $97,000. By 1986 the average price of a home was $109,000. Write a linear model for the price of a home, P , in Brainerd County as a function of the year, t .
Let t = 0 correspond to 1980.
3. GRIDDED RESPONSE Grid the correct answer on a separate gridding sheet.
An oceanographic research ship's submersible vehicle is at a depth of 1583 meters when it begins a steady ascent. If it rises at a rate of 68 meters per minute, how many minutes will it take the submersible to reach a depth of 631 meters?
4. GRIDDED RESPONSE Grid the correct answer on a separate gridding sheet.
One cellular phone company charges $27.95 per month and $0.17 per minute of usage. A competitor offers a plan that has no monthly charge, but charges $0.36 per minute of usage. If a customer uses 170 minutes per month, how many dollars can be saved in one month by choosing the plan that does not have a monthly fee?
If that plan is not cheaper, the answer is 0.
5. Write an equation of the line passing through the point with slope .
____ 6.
Which is the equation for the linear function f in the form
, a. b. c. d.
that has the given values?
____ 7. , a. b. c. d.
8. Write an equation of the line, in point-slope form, that passes through the points (–7, 2) and (3, –2). Use (–7,
2) as the point
9. GRIDDED RESPONSE Grid the correct answer on a separate gridding sheet.
What is the missing number in the sequence?
1
5
, ,
4
5
, ____, 7
2
5
, . . .
10. The table shows the cost of having a pizza party at a local restaurant.
Number of people
Cost (dollars)
2
16
4
28
6
40
8
52
10
64 a. Find the rate of change for consecutive data pairs in the table. b. Can the data be modeled by a linear equation? Justify your answer. c. Write an equation that gives the cost as a function of the number of people.
d. Use the equation to find the cost for 7 people.
11. Write the equation of the line passing through (1, –2), (5, –2), and (10, –2).
12. Write the equation of the vertical line that passes through the point (7, –3).
13. The clearing house has resistors that sell for $3.50 each and circuit boards that sell for $2.25 each. Write an equation that represents how many of each type of electronic equipment can be bought with $7.
Write an equation in standard form of the line that passes through the given point and has the given slope m or that passes through the two given points.
14.
Write two equations in standard form that are equivalent to the given equation.
15.
16. A line passes through the points (6, 4) and (3, –2). a. What is the slope of the line? Write an equation of the line in point-slope form. b. What method would you use to rewrite the equation you wrote in part (a) in standard form? What is an equation of the line in standard form?
____ 17. Which of the following lines is NOT parallel to the line shown in the graph? y
10
–10 10 x
–10 a. b. c. d.
18. A pedestrian bridge is to be built over railroad tracks running through a town. The bridge will be perpendicular to the tracks and the middle of the bridge will be directly above the tracks. If the town is represented on a coordinate grid, the tracks are a straight line running through and , with one end of the bridge at .
Tracks
(9, 15)
(–8, 8)
(–12, –6)
Bridge
What are the coordinates of the other end of the bridge?
19. SHORT RESPONSE Write your answer on a separate piece of paper.
Consider the graph below. y
10
A
–10
B
10 x
–10
Part A What is the slope of the line that passes through
Part B Suppose another line, m
1
2 perpendicular to m , or neither? Explain how you can tell.
20. Write an equation of a line that is parallel to the line your equation is parallel to .
21. What type of relationship is shown by the scatter plot?
and ?
and parallel to m ,
. Explain how you know that the graph of
____ 22. Which equation matches the scatter plot? y
1
1 x a. b.
23. For the following data: a. Make a scatter plot of the data. b. Draw a line of fit for your scatter plot. c. Write an equation of your line of fit. c. d. x 1 2 3 4 5 6 7 8 y 1.5 6.75 4.25 4.75 5.5 8.25 8.5 14.25
y x
Writing:
24. Explain what a scatter plot is and why it is useful.
25. The table gives the times spent watching TV and the grades of several students.
Weekly TV (h)
Grade (%)
6
80
12
95
18
75
24
85
30
60
36
70
Display the data on a scatter plot of grade versus time. Describe any relationship you see.
26. The weights of ten Holstein calves of different ages are given in the table. Sketch a scatter plot of the data.
Then describe any pattern that you see in the scatter plot.
Age
(months)
Weight
(pounds)
2
230
2
250
3
320
5
590
6
680
8
920
8
960
9
1020
10
1250
12
1350
27. In the table, x represents the number of years a company has been in business and y represents the number of employees that the company has. Construct a scatter plot with a fitted line for this data and find an equation you think best represents the data. What can you conclude about the data, based on the scatter plot? x y
1 2 3 4 5 6 7 8
15 21 27 28 39 40 44 52
28. A biology student recorded data for a science project and graphed them on a scatter plot. a. Draw a line that appears to fit the points in the scatter plot closely. b. Write an equation for the line you drew. Explain how you wrote the equation. c. Predict the value of y if x = 3.5 and if x = 8. Explain how you made your predictions.
Algebra 1 Mid term review
Answer Section
1. ANS: A PTS: 1 DIF: Level A
TOP: Lesson 5.1 Write Linear Equations in Slope-Intercept Form
REF: MALG0715
KEY: slope-intercept | line MSC: Knowledge NOT: 978-0-547-31539-3
2. ANS:
PTS: 1 DIF: Level C REF: MALG0738
NAT: NCTM.PSSM.00.MTH.9-12.PRS.3 | NCTM.PSSM.00.MTH.9-12.REP.2
TOP: Lesson 5.1 Write Linear Equations in Slope-Intercept Form
KEY: word | linear equation MSC: Application NOT: 978-0-547-31539-3
3. ANS: 14
PTS: 1 DIF: Level B REF: MALG0742
NAT: NCTM.PSSM.00.MTH.9-12.PRS.3 | NCTM.PSSM.00.MTH.9-12.REP.1 | NCTM.PSSM.00.MTH.9-
12.REP.2
TOP: Lesson 5.1 Write Linear Equations in Slope-Intercept Form
KEY: solve | equation | solution | word | real-life | linear MSC: Application
NOT: 978-0-547-31539-3
4. ANS: 0
PTS: 1 DIF: Level B REF: MALG0220
NAT: NCTM.PSSM.00.MTH.9-12.ALG.2.c | NCTM.PSSM.00.MTH.9-12.PRS.2 |
NCTM.PSSM.00.MTH.9-12.REP.1
TOP: Lesson 5.1 Write Linear Equations in Slope-Intercept Form
KEY: solve | equation | solution | word | real-life | linear MSC: Application
NOT: 978-0-547-31539-3
5. ANS:
PTS: 1 DIF: Level A REF: MALG0749
TOP: Lesson 5.2 Use Linear Equations in Slope-Intercept Form
KEY: equation | slope | point | slope-intercept MSC: Knowledge
NOT: 978-0-547-31539-3
6. ANS: A PTS: 1 DIF: Level B
TOP: Lesson 5.2 Use Linear Equations in Slope-Intercept Form
REF: MALG0763
KEY: function | linear | point | slope-intercept
NOT: 978-0-547-31539-3
MSC: Comprehension
7. ANS: A PTS: 1 DIF: Level B
TOP: Lesson 5.2 Use Linear Equations in Slope-Intercept Form
REF: MALG0764
KEY: function | linear | point | slope-intercept
NOT: 978-0-547-31539-3
MSC: Comprehension
8. ANS:
PTS: 1 DIF: Level A REF: MALG0780
TOP: Lesson 5.3 Write Linear Equations in Point-Slope Form KEY: line | point-slope form
MSC: Comprehension NOT: 978-0-547-31539-3
9. ANS: 28/5 or 5
3
5
PTS: 1 DIF: Level B REF: MALG0120
TOP: Lesson 5.3 Write Linear Equations in Point-Slope Form
KEY: pattern | number | missing | sequence
NOT: 978-0-547-31539-3
MSC: Comprehension
10. ANS: a. The rate of change for each consecutive data pair is 12. b. Yes. The rate of change is the same for each data pair, meaning the cost increases at a constant rate of $12 for every two people, or $6 per person. c. C = 6 p + 4 d. $46
PTS: 1 DIF: Level A REF: A1.05.03.ER.07
NAT: NCTM.PSSM.00.MTH.9-12.ALG.1.a | NCTM.PSSM.00.MTH.9-12.ALG.1.b |
NCTM.PSSM.00.MTH.9-12.ALG.1.c | NCTM.PSSM.00.MTH.9-12.ALG.1.e | NCTM.PSSM.00.MTH.9-
12.ALG.2.c | NCTM.PSSM.00.MTH.9-12.GEO.4.e | NCTM.PSSM.00.MTH.9-12.CON.3 TOP:
Lesson 5.3 Write Linear Equations in Point-Slope Form
KEY: extended response | write linear equations
NOT: 978-0-547-31539-3
MSC: Application
11. ANS: y = –2
PTS: 1 DIF: Level B REF: MALG0791
TOP: Lesson 5.4 Write Linear Equations in Standard Form
KEY: line | ordered pairs | equation | points | horizontal line
NOT: 978-0-547-31539-3
MSC: Comprehension
12. ANS: x = 7
PTS: 1 DIF: Level A REF: MALG0795
TOP: Lesson 5.4 Write Linear Equations in Standard Form KEY: point | equation | vertical line
MSC: Knowledge NOT: 978-0-547-31539-3
13. ANS:
PTS: 1 DIF: Level B REF: MALG0800
TOP: Lesson 5.4 Write Linear Equations in Standard Form
MSC: Comprehension KEY: equation | model | linear | standard form | write
NOT: 978-0-547-31539-3
14. ANS:
PTS: 1 DIF: Level B REF: 7eea014b-cdbb-11db-b502-0011258082f7
TOP: Lesson 5.4 Write Linear Equations in Standard Form KEY: Linear equation | standard form
MSC: Comprehension NOT: 978-0-547-31539-3
15. ANS:
Sample answer:
PTS: 1 DIF: Level B REF: 7f26d373-cdbb-11db-b502-0011258082f7
TOP: Lesson 5.4 Write Linear Equations in Standard Form KEY: linear equations | standard form
MSC: Knowledge NOT: 978-0-547-31539-3
16. ANS: a. 2; y – 4 = 2( x – 6) b. Use the distributive property to clear the parentheses; add 4 to both sides of the equation; and combine like terms; 2 x – y = 8.
PTS: 1 DIF: Level A REF: A1.05.04.SR.09
NAT: NCTM.PSSM.00.MTH.9-12.COM.1 | NCTM.PSSM.00.MTH.9-12.COM.2 |
NCTM.PSSM.00.MTH.9-12.REP.1 TOP: Lesson 5.4 Write Linear Equations in Standard Form
KEY: short response | point-slope form | standard form MSC: Comprehension
NOT: 978-0-547-31539-3
17. ANS: A PTS: 1 DIF: Level B REF: MALG0816
TOP: Lesson 5.5 Write Equations of Parallel and Perpendicular Lines
KEY: line | equation | parallel
NOT: 978-0-547-31539-3
MSC: Comprehension
18. ANS:
PTS: 1 DIF: Level C REF: MALG0786 NAT: NCTM.PSSM.00.MTH.9-12.PRS.2
TOP: Lesson 5.5 Write Equations of Parallel and Perpendicular Lines
KEY: slope | parallel | perpendicular | line
NOT: 978-0-547-31539-3
MSC: Comprehension
19. ANS:
Part A The slope of the line that passes through and
1
3
1
=
3
Part B Parallel lines have equal slopes, perpendicular lines have slopes that are negative reciprocals. The slopes of the line through and and line m are not equal nor negative reciprocals, so they are neither parallel nor perpendicular.
PTS: 1 DIF: Level B REF: MALG0817
NAT: NCTM.PSSM.00.MTH.9-12.ALG.1.c
TOP: Lesson 5.5 Write Equations of Parallel and Perpendicular Lines
KEY: slope | parallel | perpendicular MSC: Analysis NOT: 978-0-547-31539-3
20. ANS:
Sample line: 2 x + 3 y = 14, with slope and y -intercept ; The slope of is and its y intercept is 2. Any line that has the same slope as the line parallel to .
and a different y -intercept will be
PTS: 1 DIF: Level A
NAT: NCTM.PSSM.00.MTH.9-12.PRS.4
REF: A1.05.05.OE.12
TOP: Lesson 5.5 Write Equations of Parallel and Perpendicular Lines
KEY: open ended MSC: Comprehension NOT: 978-0-547-31539-3
21. ANS:
strong negative correlation
PTS: 1 DIF: Level A REF: MALG0821
NAT: NCTM.PSSM.00.MTH.9-12.ALG.1.c | NCTM.PSSM.00.MTH.9-12.DAP.1.d
TOP: Lesson 5.6 Fit a Line to Data
NOT: 978-0-547-31539-3
KEY: scatter plot MSC: Knowledge
22. ANS: A PTS: 1 DIF: Level B REF: MALG0836
NAT: NCTM.PSSM.00.MTH.9-12.ALG.3.a | NCTM.PSSM.00.MTH.9-12.DAP.1.d |
NCTM.PSSM.00.MTH.9-12.DAP.2.b | NCTM.PSSM.00.MTH.9-12.DAP.2.e
TOP: Lesson 5.6 Fit a Line to Data KEY: scatter plot MSC: Comprehension
NOT: 978-0-547-31539-3
23. ANS: a and b. y x c. Sample equation
PTS: 1 DIF: Level B REF: MALG0832
NAT: NCTM.PSSM.00.MTH.9-12.DAP.1.d | NCTM.PSSM.00.MTH.9-12.DAP.2.b
TOP: Lesson 5.6 Fit a Line to Data
MSC: Comprehension
KEY: data | graph | scatter plot
NOT: 978-0-547-31539-3
24. ANS:
Sample answer: A scatter plot is a graph that models a relationship between two sets of data. It is useful because it can be used to determine trends and to make predictions.
PTS: 1 DIF: Level B REF: MALG0824
NAT: NCTM.PSSM.00.MTH.9-12.DAP.1.d TOP: Lesson 5.6 Fit a Line to Data
KEY: scatter plot MSC: Comprehension NOT: 978-0-547-31539-3
25. ANS:
More hours spent watching TV may reduce grades.
PTS: 1 DIF: Level B REF: MALG0825
NAT: NCTM.PSSM.00.MTH.9-12.ALG.3.c | NCTM.PSSM.00.MTH.9-12.DAP.1.d |
NCTM.PSSM.00.MTH.9-12.DAP.2.b TOP: Lesson 5.6 Fit a Line to Data
KEY: scatter plot MSC: Comprehension NOT: 978-0-547-31539-3
26. ANS:
Weight tends to increase with age and the pattern of the points is approximately linear.
PTS: 1 DIF: Level B REF: MALG0827
NAT: NCTM.PSSM.00.MTH.9-12.ALG.3.c | NCTM.PSSM.00.MTH.9-12.DAP.1.d |
NCTM.PSSM.00.MTH.9-12.DAP.2.b
KEY: data | scatter plot | pattern
NOT: 978-0-547-31539-3
TOP: Lesson 5.6 Fit a Line to Data
MSC: Comprehension
27. ANS:
The longer the company is in business, the more employees it has.
PTS: 1 DIF: Level B REF: MMT30293 TOP: Lesson 5.6 Fit a Line to Data
KEY: line | equation | data | interpret | scatter plot MSC: Application
NOT: 978-0-547-31539-3
28. ANS:
Note: These answers will vary, depending upon the line the student draws. a. Sample graph:
b. Sample equation: ; sample explanation: I chose two points on the line and used them to find the slope. Then, I substituted the slope (0.5) and the coordinates of one of the points in the equation and solved the equation to find b = 2. c. Sample answers: When x = 3.5, y = 3.75; when x = 8, y = 6; find 3.5 on the graph and estimate that y = 3.75 or substitute 3.5 for x in the equation and solve for y . You can use similar methods to predict the y -value when x = 8.
PTS: 1 DIF: Level C REF: A1.05.06.ER.15
NAT: NCTM.PSSM.00.MTH.9-12.ALG.3.a | NCTM.PSSM.00.MTH.9-12.GEO.4.e |
NCTM.PSSM.00.MTH.9-12.MEA.2.c | NCTM.PSSM.00.MTH.9-12.DAP.1.d | NCTM.PSSM.00.MTH.9-
12.DAP.2.e | NCTM.PSSM.00.MTH.9-12.COM.1 | NCTM.PSSM.00.MTH.9-12.COM.2 |
NCTM.PSSM.00.MTH.9-12.CON.3 | NCTM.PSSM.00.MTH.9-12.REP.1 with Linear Models
TOP: Lesson 5.7 Predict
KEY: extended response | best-fitting line | scatter plot
NOT: 978-0-547-31539-3
MSC: Application
