Comparison of doing muons through Geant4 vs MUSUN The muon
advertisement
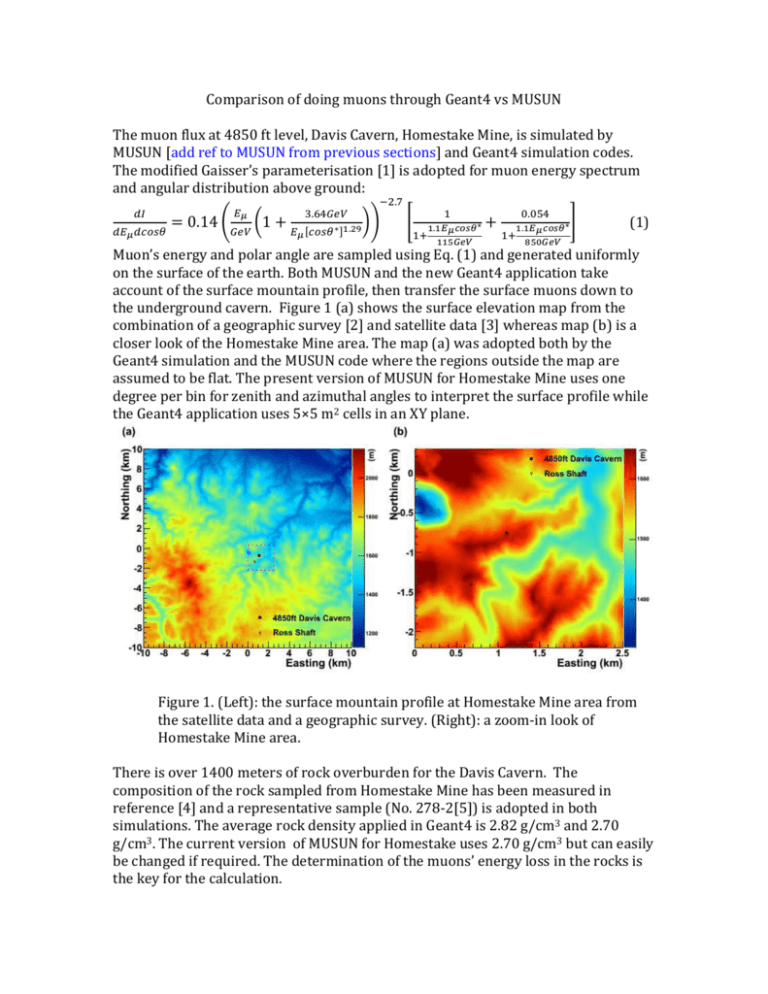
Comparison of doing muons through Geant4 vs MUSUN The muon flux at 4850 ft level, Davis Cavern, Homestake Mine, is simulated by MUSUN [add ref to MUSUN from previous sections] and Geant4 simulation codes. The modified Gaisser’s parameterisation [1] is adopted for muon energy spectrum and angular distribution above ground: −2.7 𝑑𝐼 𝑑𝐸𝜇 𝑑𝑐𝑜𝑠𝜃 = 0.14 ( 𝐸𝜇 𝐺𝑒𝑉 (1 + 3.64𝐺𝑒𝑉 𝐸𝜇 [𝑐𝑜𝑠𝜃 ∗ ]1.29 )) [ 1 1.1𝐸𝜇 𝑐𝑜𝑠𝜃∗ 1+ 115𝐺𝑒𝑉 + 0.054 1.1𝐸𝜇 𝑐𝑜𝑠𝜃∗ 1+ 850𝐺𝑒𝑉 ] (1) Muon’s energy and polar angle are sampled using Eq. (1) and generated uniformly on the surface of the earth. Both MUSUN and the new Geant4 application take account of the surface mountain profile, then transfer the surface muons down to the underground cavern. Figure 1 (a) shows the surface elevation map from the combination of a geographic survey [2] and satellite data [3] whereas map (b) is a closer look of the Homestake Mine area. The map (a) was adopted both by the Geant4 simulation and the MUSUN code where the regions outside the map are assumed to be flat. The present version of MUSUN for Homestake Mine uses one degree per bin for zenith and azimuthal angles to interpret the surface profile while the Geant4 application uses 5×5 m2 cells in an XY plane. Figure 1. (Left): the surface mountain profile at Homestake Mine area from the satellite data and a geographic survey. (Right): a zoom-in look of Homestake Mine area. There is over 1400 meters of rock overburden for the Davis Cavern. The composition of the rock sampled from Homestake Mine has been measured in reference [4] and a representative sample (No. 278-2[5]) is adopted in both simulations. The average rock density applied in Geant4 is 2.82 g/cm3 and 2.70 g/cm3. The current version of MUSUN for Homestake uses 2.70 g/cm3 but can easily be changed if required. The determination of the muons’ energy loss in the rocks is the key for the calculation. Geant4 tracks muons step by step. All processes of muon energy loss are automatically registered and simulated by Geant4 itself. MUSIC (the muon transport code whose results are used in MUSUN) [add reference to MUSIC from the previous sections] also tracks and simulates individual muon and processes involved in muon energy loss. MUSIC, however, does not track secondary particles produced as a result of muon interactions. This makes the code run faster but still reliable since transport of secondary particles does not affect muon fluxes underground. The absolute muon flux at the Davis Cavern is determined mainly by four factors, the surface mountain profile, the rock density and composition, the muon energy spectrum at sea level and muon interaction cross-sections . Due to the complexity of the geological structure, the simulation with a homogeneous rock with a single density and composition (which may not be very well determined) can only give an approximate value for the muon flux. The calculated total muon flux has to be normalized to the results from measurements. The muon energy distribution obtained from these different approaches (GEANT4 and MUSUN) is shown in Figure 3. The absolute fluxes in the left plot are calculated to be 5.31e-9 cm-2s-1, 6.15e-9 cm-2s-1, 4.85e-9 cm-2s-1 and 4.40e-9 cm-2s-1 for MUSUN(ρ=2.70), GEANT4(ρ=2.70), GEANT4(ρ=2.82) and Mei & Hime prediction, respectively. Since the calculation of the absolute fluxes depend on multiple unknown parameters, the total fluxes are normalized to 1 in order to compare the shapes of muon energy spectra (Figure 3, right plot). Figure 3. Muon energy spectrum at 4850 ft Davis Cavern estimated by MUSUN, GEANT4 and Mei&Hime prediction [6]. The left plot is the comparison for the absolute fluxes while the right plot is the comparison with the fluxes normalized to 1. Figure 4. Comparison of muon angular distribution at 4850 ft Davis Cavern estimated by MUSUN and GEANT4. Both of the flux are normalized to 1. Comparison of the muon angular distribution obtained using MUSUN and Geant4 code is shown in Figure 4. The spectrum match each other quite well regardless the absolute normalization. The total muon flux underground appears to be very sensitive to the average rock density assumed here. Roughly 1% of density change would cause 5% of total flux variation, accordingly. The muon energy spectrum at sea level is another source to affect the results. Instead of using Eq. (1), the traditional MUSUN takes the Gaisser’s formula with the spectra index of -2.77 and normalization factor of 0.14×1.84 for muon energies above 1.5 TeV. Such a change makes the calculated muon flux at the Davis Cavern vary from 5.31e-9 cm-2s-1 to 5.51e-9 cm-2s-1. Muon’s angular distribution is sensitive to the surface mountain profile and the structure of penetrating rock. The elevation map we used here assumed an uniform rock density which is a rough approximation from the reality. Adopting such an assumption, the slant depths to an underground lab can be actually measured through a moun detector which can be converted to an equivalent elevation map. An example is set for Soudan Lab whose slant depths are measured by MINOS (Figure 5. Left) which combined the variation of surface mountain profile and the rock structure while the satellite data (Figure 5. Right) only takes the surface profile into account. Two independent simulations conducted by adopting the two elevation maps using MUSUN and GEANT4, individually. The effect on the angular distribution is presented in Figure 6 which indicates ~15% discrepancy induced by the two elevation maps. Figure 5. Left: the equivalent elevation map around Soudan Mine area converted from the slant depths measured by MINOS experiment [7]. Right: digitized elevation map around Soudan mine area from the satellite data [3]. Figure 6. comparison of muon angular distribution at Soudan mine got from GEANT4 and MUSUN by using different elevation maps. [1] T. K. Gaisser and T. Stanev, “cosmic rays”, review of particle physics, Phys. Lett. B 592 (2004) 1. [2] Geographic survey data are provided by SURF. [3] http://eros.usgs.gov/ [4] B.T. Jordan, Geochemistry tectonic setting of the Yates unit of the Poorman Formation (DUSEL bedrock) and other northern Black Hills amphibolites: geological Society of Americal Abstracts with Programs 41 (7) (2009) 271 [5] D.-M. Mei et al., Astroparticle physics 34(2010)33-39 [6] D.-M. Mei, A. Hime, Phys. Rev. D 73(2006)053004 [7] http://homepages.spa.umn.edu/~schubert/far/s2rock/vdepav.data
