Stephanie Rosse BIOST 516/EPI 516/PHG 519: Autumn Quarter

Stephanie Rosse
BIOST 516/EPI 516/PHG 519: Autumn Quarter 2010
Homework 4
Due Wednesday, November 17, 2010
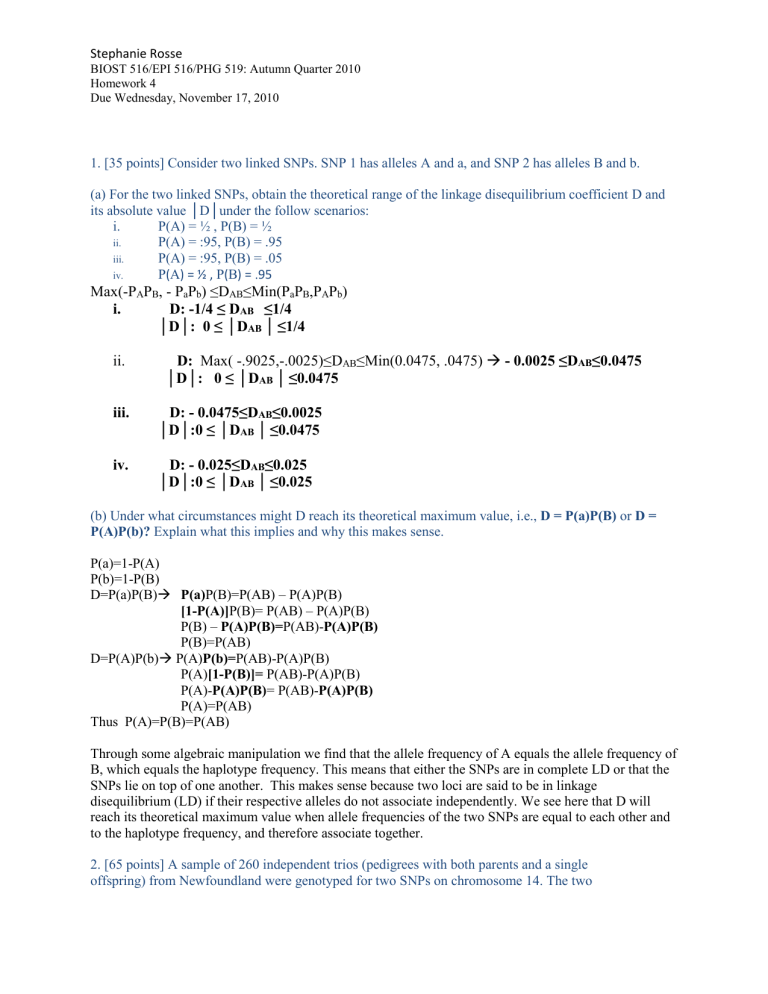
1. [35 points] Consider two linked SNPs. SNP 1 has alleles A and a, and SNP 2 has alleles B and b.
(a) For the two linked SNPs, obtain the theoretical range of the linkage disequilibrium coefficient D and its absolute value │D│under the follow scenarios: i.
P(A) = ½ , P(B) = ½ ii.
P(A) = :95, P(B) = .95
iii.
P(A) = :95, P(B) = .05
iv.
P ( A ) = ½ , P ( B ) = .
95
Max(-P
A
P
B
, - P a
P b
) ≤D
AB
≤Min(P a
P
B
,P
A
P b
) i.
D: -1/4 ≤ D
AB
≤1/4
│D│: 0 ≤ │D
AB
│ ≤1/4 ii.
D: Max( -.9025,-.0025)≤D
AB
≤Min(0.0475, .0475)
- 0.0025 ≤D
AB
≤0.0475
│D│:
0 ≤ │D
AB
│ ≤0.0475 iii.
D: - 0.0475≤D
AB
≤0.0025
│D│:0 ≤ │D
AB
│ ≤0.0475 iv.
D: - 0.025≤D
AB
≤0.025
│D│:0 ≤ │D
AB
│ ≤0.025
(b) Under what circumstances might D reach its theoretical maximum value, i.e., D = P(a)P(B) or D =
P(A)P(b)?
Explain what this implies and why this makes sense.
P(a)=1-P(A)
P(b)=1-P(B)
D=P(a)P(B)
P(a) P(B)=P(AB) – P(A)P(B)
[1-P(A)]
P(B) –
P(B)= P(AB) – P(A)P(B)
P(A)P(B)= P(AB)P(A)P(B)
P(B)=P(AB)
D=P(A)P(b)
P(A) P(b)= P(AB)-P(A)P(B)
P(A) [1-P(B)]= P(AB)-P(A)P(B)
P(A)P(A)P(B) = P(AB)P(A)P(B)
P(A)=P(AB)
Thus P(A)=P(B)=P(AB)
Through some algebraic manipulation we find that the allele frequency of A equals the allele frequency of
B, which equals the haplotype frequency. This means that either the SNPs are in complete LD or that the
SNPs lie on top of one another. This makes sense because two loci are said to be in linkage disequilibrium (LD) if their respective alleles do not associate independently. We see here that D will reach its theoretical maximum value when allele frequencies of the two SNPs are equal to each other and to the haplotype frequency, and therefore associate together.
2. [65 points] A sample of 260 independent trios (pedigrees with both parents and a single offspring) from Newfoundland were genotyped for two SNPs on chromosome 14. The two
Stephanie Rosse
BIOST 516/EPI 516/PHG 519: Autumn Quarter 2010
Homework 4
Due Wednesday, November 17, 2010
SNPs are linked, and SNP 1 has alleles A
1 and A
2
, and SNP 2 has alleles B
1 and B
2
. The haplotypes for all 260 offspring were phased using the parental genotypes, and the observed paired haplotype counts for the offspring are as follows: a) Where n= number of individuals in sample
P(A1)=probability random allele in population is type A1
SNP1: A1A2
Genotype
A1A1
A1A2
A2A2
Observation
36+62+17=115
5+28+24+62=119
6+11+9=26
Estimation of PA1
P
A1
≈P
Â1
=2(nA1A1)+nA1A2/(2*N)=[2(115)+119]/(2*260)=0.6712
Expected nP
A1
2nP
2 =117.13
A1
(1-PA1)=114.76 n(1-P
A1
) 2 =28.11
X2=(115-117.13)2/117.13 + (119-114.76)2/114.76 + (26-28.11)2/28.11=.3538
We are estimating 2 parameters (A1 and A2) so we perform the Chi2 test with 1 degree of freedom for our test statistic of 0.3538 p-value=0.552
SNP2: B1B2
Genotype
B1B1
B1B2
B2B2
Observation
36+5+6=47
62+28+24+11=125
17+62+9=88
PB1=P B 1=(2(47)+125)/(2*260)=0.42115
Expected nP
B1
2
2nP
B1
X 2 =(47-46.13) 2 /46.13 + (125-126.77) 2 /126.77 + (88-87.10) 2 /87.10= 0.050421
=46.13
(1-P n(1-P
B1
) 2
B1
)=126.77
=87.10 p-value = 0.8224
We retain the null that these SNPs are in HWE.
Stephanie Rosse
BIOST 516/EPI 516/PHG 519: Autumn Quarter 2010
Homework 4
Due Wednesday, November 17, 2010 b) Count
A1B1
A1B2
A2B1
A2B2
Allele Frequency
2(36) + 62 + 5 + 28= 167
62 + 17(2) + 24 + 62=182
5 + 24 + 12 + 11=52
28 + 62 + 11 + 18= 119
P
167/2(260) = .3212
0.35
0.1
0.2288
PA1=.3212 + .35= 0.6712
PA2=.1 + .228= 0.3288
PB1= .3212+.1=0.4212
PB2= .35 + .2288= 0.5788
Expected Haplotype Counts
A1B1=520(.6712)(.4212)= 147.01
A1B2=520(0.6712)(.5788)= 202.0
A2B1=520(0.3288)(.4212)=72.02
A2B2=520(.3288)(.5788)=98.96
X 2 =(167-147.01) 2 /147.01 + (182-202.02) 2 /202.02 + (52-72.02) 2 /72.02 + (119-98.96) 2 /98.96 = 14.325 p-value= 0.000154
We reject the null and conclude that there is strong evidence that these SNPs are in Linkage
Disequilibrium (p<.01).
C.
𝐷
𝐷
′
=
𝑀𝑖𝑛 (𝑃𝐴2𝐵1,𝑃𝐴1𝐵2)
= .03849/(.3288 ∗ .4212, .6712 ∗ .5788) =.2773
Stephanie Rosse
BIOST 516/EPI 516/PHG 519: Autumn Quarter 2010
Homework 4
Due Wednesday, November 17, 2010
2
𝐷
2
𝑃𝐴1𝑃𝐴2𝑃𝐵1𝑃𝐵2
=
. 03849
2
. 6712
∗ .3288 ∗ .4212 ∗ .5788 = .0275


