Graphing Linear Inequalities: y > mx + b, etc
First off, let me say that graphing linear inequalities is much easier than your book makes it look. Here's
how it works:
Think about how you've done linear inequalities on the number line. For instance, they'd ask you to graph
something like x > 2. How did you do it? You would draw your number line, find the "equals" part (in this
case, x = 2), mark this point with the appropriate notation (an open dot or a parenthesis, indicating that
the point x = 2 wasn't included in the solution), and then you'd shade everything to the right, because
"greater than" meant "everything off to the right". The steps for graphing two-variable linear inequalities
are very much the same.
Graph the solution to y <
2x + 3.
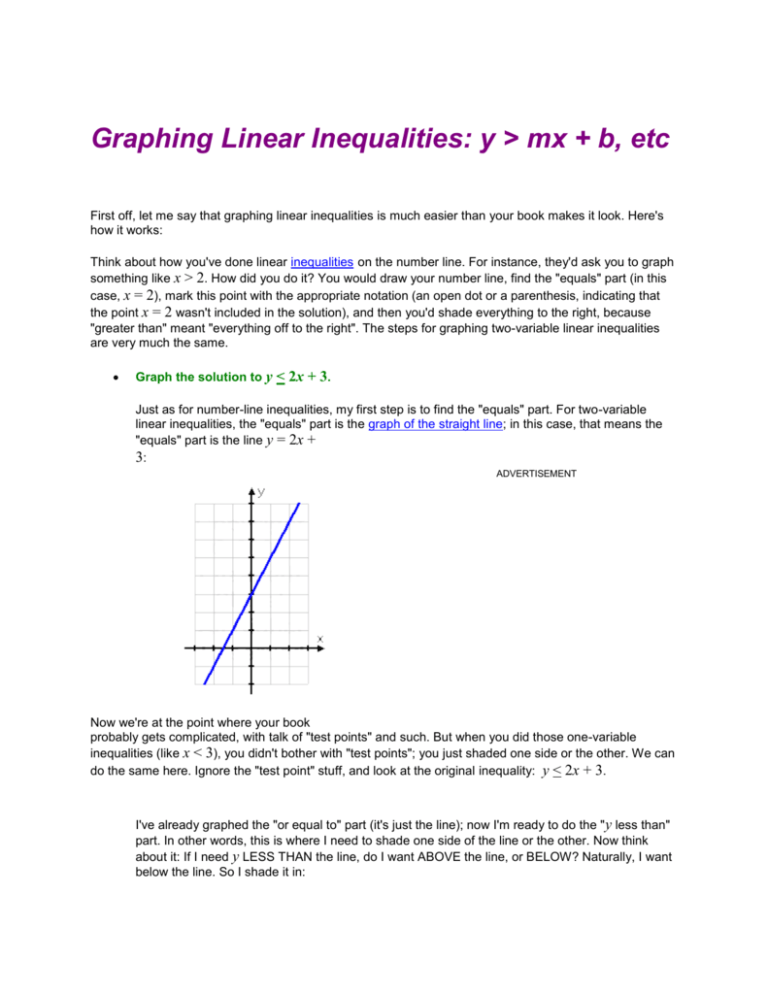
Just as for number-line inequalities, my first step is to find the "equals" part. For two-variable
linear inequalities, the "equals" part is the graph of the straight line; in this case, that means the
"equals" part is the line y = 2x +
3:
ADVERTISEMENT
Now we're at the point where your book
probably gets complicated, with talk of "test points" and such. But when you did those one-variable
inequalities (like x < 3), you didn't bother with "test points"; you just shaded one side or the other. We can
do the same here. Ignore the "test point" stuff, and look at the original inequality: y < 2x + 3.
I've already graphed the "or equal to" part (it's just the line); now I'm ready to do the " y less than"
part. In other words, this is where I need to shade one side of the line or the other. Now think
about it: If I need y LESS THAN the line, do I want ABOVE the line, or BELOW? Naturally, I want
below the line. So I shade it in:
And that's all there is to it: the side I shaded is the "solution region" they want.
This technique worked because we had y alone on one side of the inequality. Just as with plain old lines,
you always want to "solve" the inequality for y on one side.
Graph the solution to 2x–
3y < 6.
First, I'll solve for y:
2x – 3y < 6
–3y < –2x + 6
y > ( 2/3 )x – 2
[Note the flipped inequality sign in the last line. I mustn't forget to flip the inequality if I multiply or
divide through by a negative!] Copyright © Elizabeth Stapel 2000-2011 All Rights Reserved
Now I need to find the "equals" part, which is the line
y = ( 2/3 )x – 2. It looks like this:
But this exercise is what is called a "strict" inequality. That is, it isn't an "or equals to" inequality;
it's only "y greater than". When I had strict inequalities on the number line (such as x < 3), I
denote this by using a parenthesis (instead of a square bracket) or an open [unfilled] dot (instead
of a closed [filled] dot). In the case of these linear inequalities, the notation for a strict inequality is
a dashed line. So the border of my solution region actually looks like this:
By using a dashed line, I still know where the border is, but I also know that the border isn't
included in the solution. Since this is a "y greater than" inequality, I want to shade above the line,
so my solution looks like this:
If you need to graph a set of two or more linear inequalities at once, view the lesson on systems of linear
inequalities.
Source: http://www.purplemath.com/modules/ineqgrph.htm

