Student Worksheets
advertisement
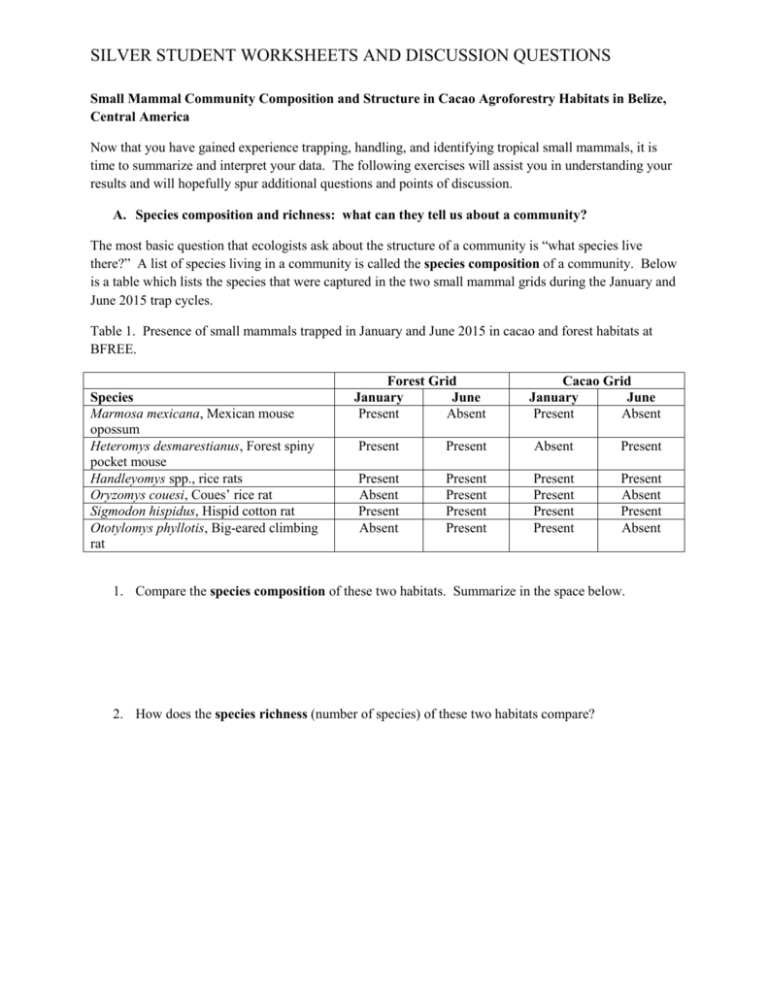
SILVER STUDENT WORKSHEETS AND DISCUSSION QUESTIONS Small Mammal Community Composition and Structure in Cacao Agroforestry Habitats in Belize, Central America Now that you have gained experience trapping, handling, and identifying tropical small mammals, it is time to summarize and interpret your data. The following exercises will assist you in understanding your results and will hopefully spur additional questions and points of discussion. A. Species composition and richness: what can they tell us about a community? The most basic question that ecologists ask about the structure of a community is “what species live there?” A list of species living in a community is called the species composition of a community. Below is a table which lists the species that were captured in the two small mammal grids during the January and June 2015 trap cycles. Table 1. Presence of small mammals trapped in January and June 2015 in cacao and forest habitats at BFREE. Species Marmosa mexicana, Mexican mouse opossum Heteromys desmarestianus, Forest spiny pocket mouse Handleyomys spp., rice rats Oryzomys couesi, Coues’ rice rat Sigmodon hispidus, Hispid cotton rat Ototylomys phyllotis, Big-eared climbing rat Forest Grid January June Present Absent Cacao Grid January June Present Absent Present Present Absent Present Present Absent Present Absent Present Present Present Present Present Present Present Present Present Absent Present Absent 1. Compare the species composition of these two habitats. Summarize in the space below. 2. How does the species richness (number of species) of these two habitats compare? SILVER STUDENT WORKSHEETS AND DISCUSSION QUESTIONS 3. Complete the table below using the results from your group’s trap cycle. Be sure to indicate the date in the title. There are extra rows for any new species that your group captured. Table 2. Presence of small mammals trapped in ____________ in cacao habitat at BFREE. Species Marmosa mexicana, Mexican mouse opossum Heteromys desmarestianus, Forest spiny pocket mouse Handleyomys spp., rice rats Oryzomys couesi, Coues’ rice rat Sigmodon hispidus, Hispid cotton rat Ototylomys phyllotis, Big-eared climbing rat Cacao Grid 4. How do the species composition and species richness from your trap cycle compare to the 2015 trap cycles? (cacao results only) Brainstorm some hypotheses that might explain any differences. SILVER STUDENT WORKSHEETS AND DISCUSSION QUESTIONS B. How do you know when you have sampled enough? When trying to describe the structure of a community, ecologists want to be sure that they invest enough time and energy to capture all the species, but not so much time and energy that they waste precious resources. A species accumulation curve allows them to plot the accumulated number of species captured against their sampling effort. Sampling effort could be defined either spatially or temporally. For example, you might want to know how many grids you need to capture all species of small mammals in the cacao (spatial) or you might want to know how many nights you should trap in order to capture all the species present in your grid (temporal). We have only 1 grid for each habitat type. We probably would get more species if we trapped in more grids across the habitats but we are limited by equipment and manpower. But for our single grid in each habitat, we can ask if the number of trap nights is adequate to capture all the species present. For example, below is a species accumulation curve from the January and June 2015 trap cycles. Notice that after day 2 in January, we captured no new species in the forest grid. However, we were still adding new species to our sample at day 6 in the cacao grid. Accumulated species richness 6 5 4 Forest January 3 Forest June 2 Cacao January Cacao June 1 0 1 2 3 4 5 6 7 Trap night Figure 1. Species accumulation curve for small mammals in cacao and forest habitats sampled in January and June 2015. 5. What does this suggest about the sampling effort required in these two habitats and during different seasons? SILVER STUDENT WORKSHEETS AND DISCUSSION QUESTIONS 6. In the space below, construct a species accumulation curve with the results from your trap cycle. How does it compare to the previous trap cycles in the cacao grid? (*Note that the y-axis is accumulated species richness. You use the total number of species captured since the beginning of the trap cycle for each trap night. For example, suppose you captured forest spiny pocket mice and cotton rats on the first and second nights and only Mexican mouse opossums on the third night. You would plot 2, 2, and 3 for your accumulated species richness for nights 1-3.) 7. While it is important to know the species composition and species richness of a habitat, these measures do not provide all the pertinent information about the structure of a community. What else would you want to know? Explain how this additional information would allow you to form a better understanding of the small mammal community. SILVER STUDENT WORKSHEETS AND DISCUSSION QUESTIONS C. Relative abundance of species is an important component of community structure. One of the pieces of information you probably listed is the relative abundance of each species. For example, consider two communities, A and B. Community A has 25 pocket mice and 27 cotton rats while community B has 2 pocket mice and 50 cotton rats. Although the species composition and richness values are equal between these communities, intuitively, we would say that the community B is less diverse than A. Knowing the relative abundance of the species allows us to see which species are rare and which are common. See the table and figure below that summarize the numbers of individuals of each species captured during the 2015 trap cycles. The table and the figure summarize the same data. Table 3. Numbers of individuals of small mammals trapped in January and June 2015 in cacao and forest habitats at BFREE. Species Marmosa mexicana, Mexican mouse opossum Heteromys desmarestianus, Forest spiny pocket mouse Handleyomys spp., rice rats Oryzomys couesi, Coues’ rice rat Sigmodon hispidus, Hispid cotton rat Ototylomys phyllotis, Big-eared climbing rat 20 18 16 14 12 10 8 6 4 2 0 Forest Grid January June 8 0 Cacao Grid January June 2 0 8 10 0 1 4 0 5 0 3 1 7 3 14 3 9 1 18 0 3 0 Cacao (Jan) Forest (Jan) Cacao (June) Forest (June) Figure 2. Numbers of individuals of small mammals trapped in January and June 2015 in cacao and forest habitats at BFREE. SILVER STUDENT WORKSHEETS AND DISCUSSION QUESTIONS 8. What patterns in relative abundance do you see between the two grids and between the seasons? Hypothesize about some explanations for these patterns. 9. Using the abundance data from your trap cycle, construct either a table or a figure summarizing your results. Be sure to include an appropriate title. How do your results compare to the 2015 trap cycles in the cacao grid? SILVER STUDENT WORKSHEETS AND DISCUSSION QUESTIONS D. An evenness index quantifies the distribution of individuals among the species. The Simpson’s measure of evenness is one of many indices we could use to quantify the equitability of small mammal species in our 2 habitats. Simpson’s measure of evenness 𝐸= Where 1 1 𝑥 𝑛 (𝑛 − 1) 𝑠 ∑𝑠𝑖=1 [ 𝑖 𝑖 ] N(N − 1) E = Simpson’s measure of evenness ni = Number of individuals of species i in the sample N = total number of individuals in the sample s = number of species in the sample Values for this index will range from 0 to 1. A value equal to 1 would indicate individuals are perfectly distributed among the species. A value closer to zero means that one to a few species are much more common than others. SILVER STUDENT WORKSHEETS AND DISCUSSION QUESTIONS Below is an example of how to calculate the Simpson’s measure of evenness using results from the June 2015 trap cycle. Forest Grid Species Heteromys desmarestianus, Forest spiny pocket mouse Handleyomys spp., rice rats Oryzomys couesi, Coues’ rice rat Sigmodon hispidus, Hispid cotton rat Ototylomys phyllotis, Big-eared climbing rat Cacao Grid n 10 n(n-1) 90 n 1 n(n-1) 0 3 6 18 306 1 0 0 0 7 42 3 6 3 6 0 0 N = 24 N(N-1) = 552 Σ ni(ni-1) = 150 N = 22 N(N-1) = 462 Σ ni(ni-1) = 312 Forest grid: 𝐸= 1 1 𝑥 𝑛 (𝑛 − 1) 𝑠 ∑𝑠𝑖=1 [ 𝑖 𝑖 ] N(N − 1) 𝐸= 1 1 𝑥 150 [ ] 5 552 = 0.735 Cacao grid: = 1 1 𝑥 𝑛 (𝑛 − 1) 𝑠 ∑𝑠𝑖=1 [ 𝑖 𝑖 ] N(N − 1) 1 𝐸= [ 312 ] 462 = 0.494 𝑥 1 3 SILVER STUDENT WORKSHEETS AND DISCUSSION QUESTIONS 10. Complete the table below with the results of your trap cycle and then calculate a Simpson’s index of evenness for each of the grids. Cacao Grid Species Total n n(n-1) N= N(N-1) = Σ ni(ni-1) = Cacao grid: 11. Interpret your index value for the cacao grid. How do your results compare to the June 2015 trap cycle in the cacao grid? SILVER STUDENT WORKSHEETS AND DISCUSSION QUESTIONS E. Diversity: How can we quantify both species richness and relative abundance in one measure? Now that we have information on both species richness and relative abundance, we can calculate a species diversity index for each of the grids. One of the most commonly used indices is the Simpson’s index of diversity. The Simpson’s index is a nonparametric measure of diversity and its use in ecology is described in detail in Krebs (1998) and Magurran (2004). The Simpson’s index is less sensitive than other measures of diversity to changes in species richness, making it a more robust measure of diversity (Magurran 2004). Keep in mind that scientists will usually calculate species diversity using several different indices. However, calculation of only the Simpson’s index will be reviewed here. Further reading about diversity measures and their uses are provided in both Krebs (1998) and Magurran (2004). When working with a small sample size (<1,000), we use the following equation: 1 − 𝐷 = 1 − ∑𝑠𝑖=1 [ Where 𝑛𝑖 (𝑛𝑖 −1) N(N−1) ] (1 – D) = Simpson’s index of diversity ni = Number of individuals of species i in the sample N = total number of individuals in the sample s = number of species in the sample The Simpson’s index of diversity calculated this way gives the probability of picking two organisms at random in the community that are different species. SILVER STUDENT WORKSHEETS AND DISCUSSION QUESTIONS Below is an example of how to calculate the Simpson’s index of diversity using results from the June 2015 trap cycle. Forest Grid Species Heteromys desmarestianus, Forest spiny pocket mouse Handleyomys spp., rice rats Oryzomys couesi, Coues’ rice rat Sigmodon hispidus, Hispid cotton rat Ototylomys phyllotis, Big-eared climbing rat Total Cacao Grid n 10 n(n-1) 90 n 1 n(n-1) 0 3 6 18 306 1 0 0 0 7 42 3 6 3 6 0 0 N = 24 N(N-1) = 552 Σ ni(ni-1) = 150 N = 22 N(N-1) = 462 Σ ni(ni-1) = 312 Forest grid: 𝑠 1 − 𝐷 = 1 − ∑[ 𝑖=1 𝑛𝑖 (𝑛𝑖 − 1) ] N(N − 1) 150 1 − 𝐷 = 1 − [552] = 0.728 Cacao grid: 𝑠 1 − 𝐷 = 1 − ∑[ 𝑖=1 𝑛𝑖 (𝑛𝑖 − 1) ] N(N − 1) 312 1 − 𝐷 = 1 − [462] = 0.325 So how do we interpret these numbers? If you were to select 2 small mammals from the forest grid AT RANDOM, the probability that those individuals are different species would be 0.728. SILVER STUDENT WORKSHEETS AND DISCUSSION QUESTIONS 12. What possible consequences did lumping the rice rats into one species have for the diversity index? 13. Using your table from # 10, calculate a Simpson’s index of diversity for the cacao grid. Cacao grid: 14. Interpret your diversity index. How does this compare to the June 2015 trap cycle in the cacao grid? SILVER STUDENT WORKSHEETS AND DISCUSSION QUESTIONS F. Putting it all together! 15. Write a summary paragraph using your results to describe the structure of the small mammal community in the cacao habitat. Were your hypothesis and predictions supported? Explain. SILVER STUDENT WORKSHEETS AND DISCUSSION QUESTIONS G. Further points of discussion 16. Other than community structure (composition, richness, evenness and diversity), what other information would be valuable to know about the small mammals living in cacao habitats? For example, suppose that the forest spiny pocket mice use the cacao habitat as a “spillover” area where young dispersing individuals can escape for the short term but do not establish home ranges. How would you determine if this was happening and why would this information be important to know when assessing the relationship between cacao agroforestry and biological conservation? Brainstorm a list of other ecological data that would be valuable. Literature Cited Krebs, C.J. 1998. Ecological methodology. 2nd edition. Benjamin Cummings. 620 pages. SILVER STUDENT WORKSHEETS AND DISCUSSION QUESTIONS Magurran, M. 2004. Measuring biological diversity. Blackwell Publishing.
