Lab activity for the week of December 1, 2014. BIEB100 Memorizing
advertisement
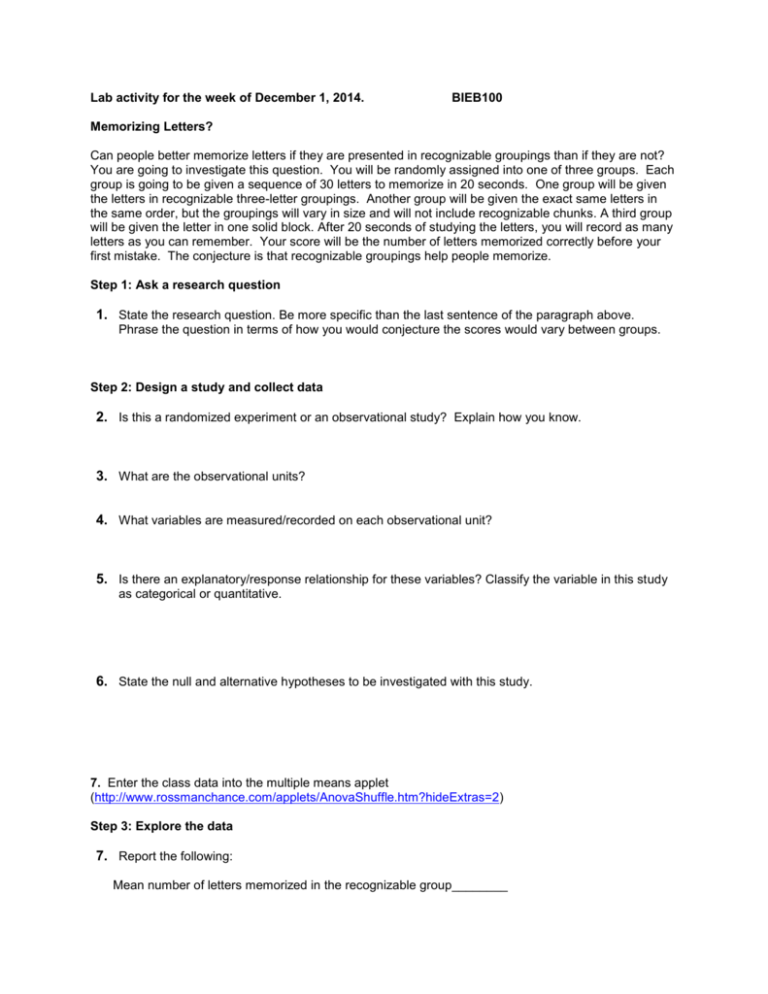
Lab activity for the week of December 1, 2014. BIEB100 Memorizing Letters? Can people better memorize letters if they are presented in recognizable groupings than if they are not? You are going to investigate this question. You will be randomly assigned into one of three groups. Each group is going to be given a sequence of 30 letters to memorize in 20 seconds. One group will be given the letters in recognizable three-letter groupings. Another group will be given the exact same letters in the same order, but the groupings will vary in size and will not include recognizable chunks. A third group will be given the letter in one solid block. After 20 seconds of studying the letters, you will record as many letters as you can remember. Your score will be the number of letters memorized correctly before your first mistake. The conjecture is that recognizable groupings help people memorize. Step 1: Ask a research question 1. State the research question. Be more specific than the last sentence of the paragraph above. Phrase the question in terms of how you would conjecture the scores would vary between groups. Step 2: Design a study and collect data 2. Is this a randomized experiment or an observational study? Explain how you know. 3. What are the observational units? 4. What variables are measured/recorded on each observational unit? 5. Is there an explanatory/response relationship for these variables? Classify the variable in this study as categorical or quantitative. 6. State the null and alternative hypotheses to be investigated with this study. 7. Enter the class data into the multiple means applet (http://www.rossmanchance.com/applets/AnovaShuffle.htm?hideExtras=2) Step 3: Explore the data 7. Report the following: Mean number of letters memorized in the recognizable group________ SD of number of letters memorized in the recognizable group________ Mean number of letters memorized in the not-recognizable group________ SD of number of letters memorized in the not-recognizable group________ Mean number of letters memorized in the solid block group ________ SD of number of letters memorized in the solid block group________ 8. Calculate the MAD (mean absolute value of the differences) for these data by hand. 9. Based on the plot of the data, does it look like the conjecture might be correct? (i.e., did the group expected to do better actually do better)? Step 4: Draw inferences 10. Use the applet to construct a simulated null distribution using the MAD statistic. Mark the observed MAD statistic calculated in the previous question on this graph. a) Paste a screen shot or draw your null distribution below with the observed MAD marked and the approximate p-value shaded in. b) Is the observed statistic out in the tail of this null distribution, or is it a fairly typical result? c) What is the p-value from your simulation? Based on this simulation analysis, would you conclude that the experiment provides strong evidence against the null hypothesis and conclude that at least one of the groups differed in its memorization performance? Explain your reasoning. 11. Calculate the Sums of Squares overall, between groups, and within groups. Determine the degrees of freedom overall, between groups, and within groups. Calculate the Mean Square between groups and within groups. Calculate the F statistic. 12. Use the applet to construct a simulated null distribution using the F statistic. Mark the observed F statistic calculated in the previous question on this graph. a) Paste a screen shot or draw your null distribution below with the observed F marked and the approximate p-value shaded in. b) Is the observed statistic out in the tail of this null distribution, or is it a fairly typical result? c) What is the p-value from your simulation? d) Do you conclude the same thing from the MAD and F statistics? 13. Are the validity conditions met to complete a theory-based ANOVA test for these data? Explain. If the conditions are met, use a theory-based ANOVA test to find a p-value for this test. 14. Are the validity conditions met so that we can perform follow-up analyses using theory-based techniques? Explain. 15. Use bootstrapping (http://www.lock5stat.com/statkey/bootstrap_1_quant_1_cat/bootstrap_1_quant_1_cat.html) to find confidence intervals for each pair of differences in population means. Comment on how this shows where differences can be established and where it is plausible there are no differences between population means. Step 5: Formulate conclusions 16. Because this is a randomized experiment, can you conclude that you have found strong evidence of a cause and effect relationship between how letters are presented and how well people can memorize them? Explain. 17. To what broader population are you willing to generalize your findings? Explain. Step 6: Look back and ahead 18. Summarize the findings from the study. What worked well in this study design? What would you change? What are some follow-up research questions you would like to explore based on the findings from this study? Speculate on whether your results might apply to other situations besides memorizing letters and briefly describe a specific study design for another such situation.


