Data Set Two Paper Route Logic
advertisement
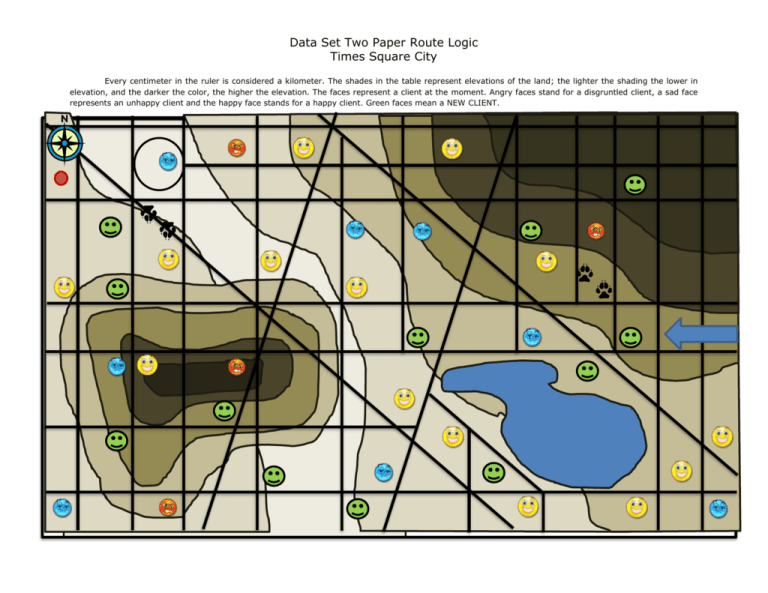
Data Set Two Paper Route Logic Times Square City Every centimeter in the ruler is considered a kilometer. The shades in the table represent elevations of the land; the lighter the shading the lower in elevation, and the darker the color, the higher the elevation. The faces represent a client at the moment. Angry faces stand for a disgruntled client, a sad face represents an unhappy client and the happy face stands for a happy client. Green faces mean a NEW CLIENT. Wind Direction Data Set Two Paper Route Logic Times Square City Travel Direction Influencing Factors Wind Direction Wolf Sightings Elevation (Challenge) Fuel cost per 45 miles traveled + 5 min per 5 cm West to East East to West North to South An increase in elevation means less fuel used therefore - $3.89 per contour line interval crossed - 5 min per 5 cm + 3 min per 5 cm + 3 min per 5 cm South to North + 10 min to total time - 2 min per 5 cm Southeast to Northwest Southwest to Northeast Northeast to Southwest + 2 min per 5 cm - 2 min per 5 cm A decrease in elevation means more fuel used therefore + $3.89 per contour line interval crossed + 2 min per 5 cm Northwest to Southeast A red dot on the map means my starting point. Please make changes to your route if you need to in order to start the route from designated point.
