Page 1 ORC STUDY #721158 CARAVAN APRIL 12
advertisement
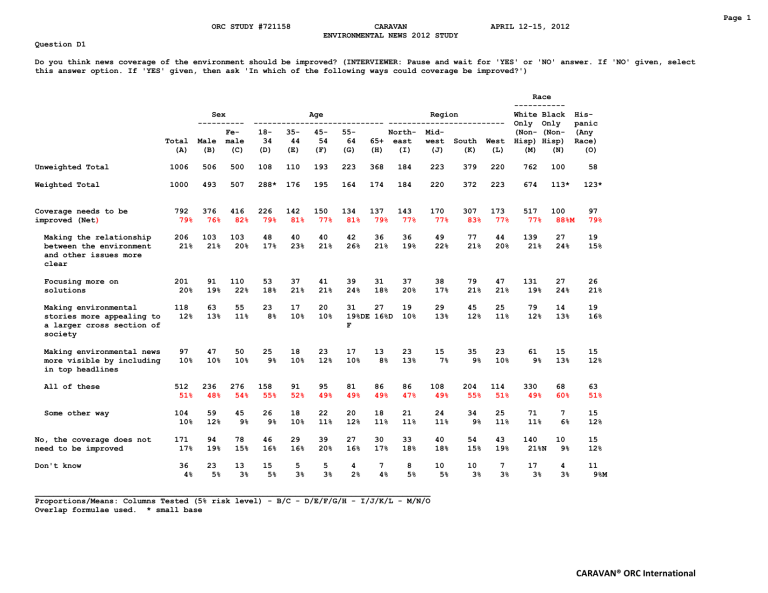
Page 1 ORC STUDY #721158 CARAVAN ENVIRONMENTAL NEWS 2012 STUDY APRIL 12-15, 2012 Question D1 Do you think news coverage of the environment should be improved? (INTERVIEWER: Pause and wait for 'YES' or 'NO' answer. If 'NO' given, select this answer option. If 'YES' given, then ask 'In which of the following ways could coverage be improved?') Total (A) Sex ---------FeMale male (B) (C) Age Region ---------------------------- ------------------------18354555North- Mid34 44 54 64 65+ east west South West (D) (E) (F) (G) (H) (I) (J) (K) (L) Race ----------White Black Only Only (Non- (NonHisp) Hisp) (M) (N) Hispanic (Any Race) (O) Unweighted Total 1006 506 500 108 110 193 223 368 184 223 379 220 762 100 Weighted Total 1000 493 507 288* 176 195 164 174 184 220 372 223 674 113* 123* 792 79% 376 76% 416 82% 226 79% 142 81% 150 77% 134 81% 137 79% 143 77% 170 77% 307 83% 173 77% 517 77% 100 88%M 97 79% Making the relationship between the environment and other issues more clear 206 21% 103 21% 103 20% 48 17% 40 23% 40 21% 42 26% 36 21% 36 19% 49 22% 77 21% 44 20% 139 21% 27 24% 19 15% Focusing more on solutions 201 20% 91 19% 110 22% 53 18% 37 21% 41 21% 39 24% 31 18% 37 20% 38 17% 79 21% 47 21% 131 19% 27 24% 26 21% Making environmental stories more appealing to a larger cross section of society 118 12% 63 13% 55 11% 23 8% 17 10% 20 10% 31 27 19%DE 16%D F 19 10% 29 13% 45 12% 25 11% 79 12% 14 13% 19 16% Making environmental news more visible by including in top headlines 97 10% 47 10% 50 10% 25 9% 18 10% 23 12% 17 10% 13 8% 23 13% 15 7% 35 9% 23 10% 61 9% 15 13% 15 12% All of these 512 51% 236 48% 276 54% 158 55% 91 52% 95 49% 81 49% 86 49% 86 47% 108 49% 204 55% 114 51% 330 49% 68 60% 63 51% Some other way 104 10% 59 12% 45 9% 26 9% 18 10% 22 11% 20 12% 18 11% 21 11% 24 11% 34 9% 25 11% 71 11% 7 6% 15 12% 171 17% 94 19% 78 15% 46 16% 29 16% 39 20% 27 16% 30 17% 33 18% 40 18% 54 15% 43 19% 140 21%N 10 9% 15 12% 36 4% 23 5% 13 3% 15 5% 5 3% 5 3% 4 2% 7 4% 8 5% 10 5% 10 3% 7 3% 17 3% 4 3% Coverage needs to be improved (Net) No, the coverage does not need to be improved Don't know 58 11 9%M _____________________________________________________________________________________ Proportions/Means: Columns Tested (5% risk level) - B/C - D/E/F/G/H - I/J/K/L - M/N/O Overlap formulae used. * small base CARAVAN® ORC International Page 2 ORC STUDY #721158 CARAVAN ENVIRONMENTAL NEWS 2012 STUDY APRIL 12-15, 2012 Question D1 Do you think news coverage of the environment should be improved? (INTERVIEWER: Pause and wait for 'YES' or 'NO' answer. If 'NO' given, select this answer option. If 'YES' given, then ask 'In which of the following ways could coverage be improved?') Total (A) Household Income -------------------------------$35K- $50K- $75K- $100K LT LT LT LT Or $35K $50K $75K $100K More (B) (C) (D) (E) (F) H.H. Size -------------3 Or 1 2 More (G) (H) (I) Children In H.H. ---------------------Under 13None Any 13 17 (J) (K) (L) (M) Education --------------------HS Coll Grad Incom- Coll or Less plete Grad (N) (O) (P) Unweighted Total 1006 331 121 139 107 149 264 393 337 757 243 183 118 343 293 358 Weighted Total 1000 362 120* 120* 108* 131 190 319 481 622 373 303 159* 454 258 276 Coverage needs to be improved (Net) 792 79% 305 84%F 99 82% 97 81% 86 79% 97 74% 161 85% 251 79% 374 78% 501 81% 288 77% 236 78% 118 74% 376 83% 194 75% 211 76% Making the relationship between the environment and other issues more clear 206 21% 60 17% 27 23% 32 27%B 23 21% 33 25% 48 26% 67 21% 90 19% 138 22% 68 18% 55 18% 28 17% 86 19% 46 18% 68 24% Focusing more on solutions 201 20% 54 15% 26 21% 30 25%B 26 24% 30 23% 35 19% 64 20% 101 21% 130 21% 71 19% 57 19% 29 18% 89 20% 50 19% 59 21% Making environmental stories more appealing to a larger cross section of society 118 12% 41 11% 17 14% 15 12% 12 11% 17 13% 39 20%I 45 14%I 34 7% 92 15%K 26 7% 21 7% 9 5% 52 11% 35 14% 30 11% Making environmental news more visible by including in top headlines 97 10% 31 9% 11 10% 13 11% 7 7% 20 15% 20 10% 22 7% 55 11% 57 9% 39 11% 29 10% 18 11% 49 11% 16 6% 30 11% All of these 512 51% 224 62%DF 63 52%F 59 49% 54 50% 49 37% 98 52% 162 51% 247 51% 313 50% 196 53% 162 53% 83 52% 254 56%P 128 50% 125 45% Some other way 104 10% 40 11% 14 12% 12 10% 21 19%F 11 9% 22 12% 45 14%I 37 8% 76 12% 27 7% 18 6% 16 10% 46 10% 20 8% 38 14%O 171 17% 49 14% 12 10% 20 16% 21 19% 33 24 25%BC 12% 56 18% 90 19% 97 16% 73 19% 56 18% 38 24% 66 15% 47 18% 57 21% 36 4% 8 2% 3 2% 2 2% 12 4% 17 4% 23 4% 13 3% 11 4% 4 2% 11 2% 17 6%N 8 3% No, the coverage does not need to be improved Don't know 9 7%BF 1 1% 5 3% ___________________________________________________________________________________ Proportions/Means: Columns Tested (5% risk level) - B/C/D/E/F - G/H/I - J/K - N/O/P Overlap formulae used. * small base CARAVAN® ORC International
