A-life-or-death-committment-Keeling
advertisement
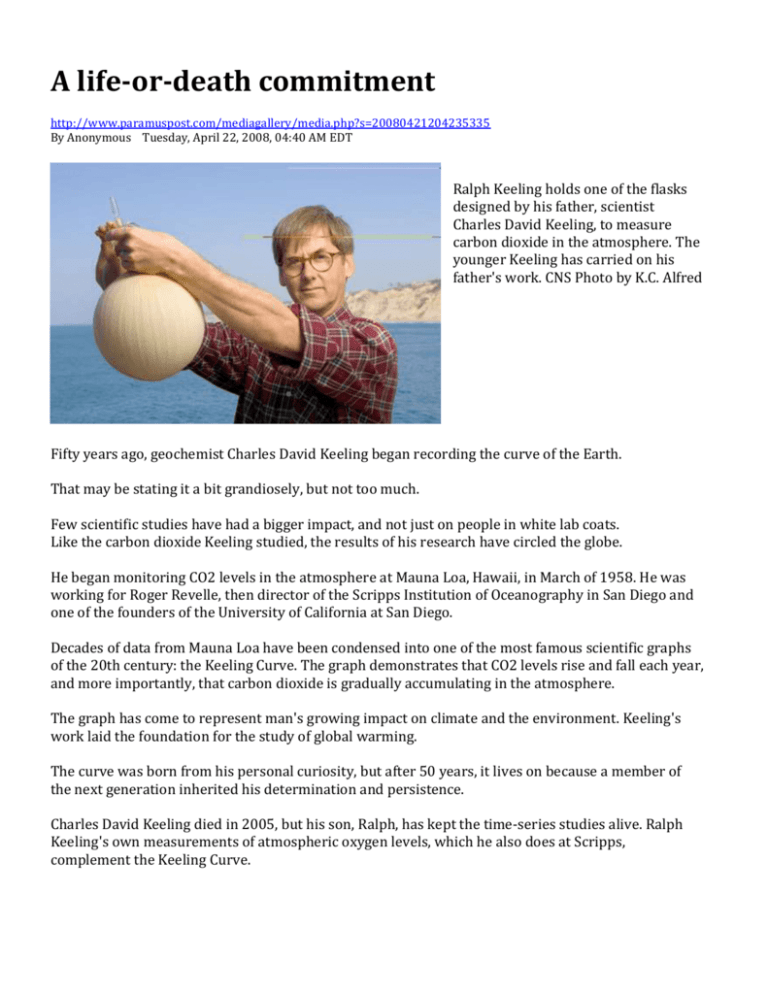
A life-or-death commitment http://www.paramuspost.com/mediagallery/media.php?s=20080421204235335 By Anonymous Tuesday, April 22, 2008, 04:40 AM EDT Ralph Keeling holds one of the flasks designed by his father, scientist Charles David Keeling, to measure carbon dioxide in the atmosphere. The younger Keeling has carried on his father's work. CNS Photo by K.C. Alfred Fifty years ago, geochemist Charles David Keeling began recording the curve of the Earth. That may be stating it a bit grandiosely, but not too much. Few scientific studies have had a bigger impact, and not just on people in white lab coats. Like the carbon dioxide Keeling studied, the results of his research have circled the globe. He began monitoring CO2 levels in the atmosphere at Mauna Loa, Hawaii, in March of 1958. He was working for Roger Revelle, then director of the Scripps Institution of Oceanography in San Diego and one of the founders of the University of California at San Diego. Decades of data from Mauna Loa have been condensed into one of the most famous scientific graphs of the 20th century: the Keeling Curve. The graph demonstrates that CO2 levels rise and fall each year, and more importantly, that carbon dioxide is gradually accumulating in the atmosphere. The graph has come to represent man's growing impact on climate and the environment. Keeling's work laid the foundation for the study of global warming. The curve was born from his personal curiosity, but after 50 years, it lives on because a member of the next generation inherited his determination and persistence. Charles David Keeling died in 2005, but his son, Ralph, has kept the time-series studies alive. Ralph Keeling's own measurements of atmospheric oxygen levels, which he also does at Scripps, complement the Keeling Curve. "In a sense, he was the first person to really commit his career to the problem of global warming," Ralph Keeling said of his father. "He was a pioneer in a new field. While he was not really doing what geochemists were supposed to do, he was recognizing that there was something else that was even possibly more important." Keeling's Curve is "monumentally important for climate study," said Tony Haymet, director of the Scripps Institution of Oceanography. "When Dave Keeling started, only Dave and his dog and Roger Revelle knew this was a problem. It's quite a journey, and I think it shows the value of data." CARBON COUNTING In the mid-1950s, before measurements of CO2 in the atmosphere had been perfected, Charles David Keeling was working on a project in Big Sur, Calif., that examined the carbon content of rivers. To understand the rivers' composition, he needed to learn about the exchange of carbon with the atmosphere. Keeling developed an apparatus that measured carbon dioxide in the air. He built a vacuum extraction system that isolated CO2; then he modernized a decades-old device called a manometer to measure the gas. He designed glass flasks, about the size of soccer balls, with small stopcocks to hold a vacuum. "I weighed them empty and filled them with water to determine their volume," the elder Keeling wrote in a brief autobiography in 1998. He later took air samples with the flasks. "I extracted the CO2 with my vacuum line, measured its amount with my new manometer, and calculated its concentration in each sample," he wrote. His method was much more precise than what others had used to examine CO2 in the air. When looking at the literature on CO2 in the atmosphere, Keeling had the impression that carbon dioxide should be quite variable depending where a person was. He expected fluctuations of as much as 100 parts per million, depending on wind direction or other factors. There was no sense there might be patterns and regularity. To his surprise, he almost always found the same number when he measured CO2 in the afternoon. Samples taken at night showed elevated levels, because plants release CO2 at night, then reabsorb it during the day. But the afternoon samples tended to give nearly the same value: about 312 parts per million. He came to believe that he was witnessing the tendency for the atmosphere well above the ground to mix with air at the surface because of heating of the ground in the afternoon. But to explain the consistent afternoon CO2 levels he was finding, there would have to be a kind of constant background. Scientists didn't know that such a background existed. This was at a time when Revelle and a few others were already thinking about the possibility that carbon dioxide was accumulating in the atmosphere. "There were discussions about how to do sampling to see whether it was building up," said Ralph Keeling, who is also a professor at Scripps. "He had the idea that maybe really all you had to do was to go to a sufficiently clean site and probe this background. You could do an accurate determination of trends just by sitting in one spot and determining what was happening with this background." That spot turned out to be Mauna Loa, which sits at more than 13,600 feet and is surrounded by thousands of miles of ocean. Keeling worked with a man named Harry Wexler at the Weather Service in Washington, D.C., while simultaneously working on a related project for Revelle at Scripps. Daily measurements began in March 1958, and air samples were shipped back to Scripps. The Mauna Loa record began shortly after CO2 measurements started at the South Pole, and Keeling examined those samples, too. But the Mauna Loa measurements took advantage of a new, more-accurate analyzer, and the South Pole records were spotty. After he had about two years of data, Keeling was able to confirm his suspicions: In addition to daily and seasonal fluctuations, atmospheric CO2 levels overall were, in fact, rising. "At that point, it wasn't even known if it was increasing or not," Ralph Keeling said. "That was a pretty significant discovery, because it legitimized further work on the carbon dioxide problem. Until you really knew something was changing, it was a dangerous investment, in a way, for scientists to work on this because the whole problem could not even be there. Very few people had worked on it." Today, there are many CO2 monitoring stations around the globe. But the Mauna Loa measurements constitute the longest continuous record of CO2 concentrations anywhere in the world. (Keeling's glass flasks are still used for CO2 research around the globe. The Mauna Loa record, however, is now based on data from a separate analyzer that provides a more-detailed, continuous measurement of CO2.) Before Keeling's work, no one knew how much of the CO2 produced by the burning of fossil fuels - if any - was being absorbed by the oceans. The curve proved that not all of that man-made CO2 was going back into the seas; some of it was accumulating in the atmosphere. Carbon dioxide is what scientists consider a greenhouse gas. It occurs naturally, but the burning of fossil fuels has increased its atmospheric concentration. Sunlight can pass through it and warm the Earth, but the gas then traps some of that heat in the atmosphere. Most climatologists theorize that as the concentration of greenhouse gases in the atmosphere increases, so will global temperatures. "In a sense, the measure of whether humanity copes with this problem or not is the Keeling Curve, the Mauna Loa record," Ralph Keeling said. "We're basically measuring the bottom line of the planet." OXYGEN DECLINE The Keeling Curve did more than simply document the rise of atmospheric carbon dioxide, which has climbed from an estimated 280 parts per million before the Industrial Revolution, to the 312 ppm Keeling first measured in the '50s, to more than 380 ppm today. The seasonal swings in the curve demonstrated that the Earth sort of breathes. When plants grow in the spring, they take up carbon dioxide through photosynthesis, and the global level dips. In the fall, leaves and decaying plants return CO2 to the soil, and the level rises. Ralph Keeling, in addition to carrying on his father's work at Mauna Loa, leads a separate study of oxygen in the atmosphere. He measures oxygen levels at nine stations around the world, from the South Pole to near the North Pole, and from San Diego to American Samoa and the northwestern tip of Tasmania. He has found that as CO2 levels rise globally, O2 levels decline. Ralph Keeling's curve points downward, while his father's points upward. "The initial goal, for my work, was to document accurately how fast the oxygen in the atmosphere was decreasing over time," he said. "And the longer the record gets, the better you're able to see that." The loss of oxygen in itself isn't an issue, he said. There's plenty of oxygen in the air, and he is studying tiny changes in the levels. What his research is clarifying is what is happening to the CO2. "We see these cycles in oxygen that help us understand the planetary metabolism," he said. "The trend in oxygen helps us understand the sources and the sinks of carbon dioxide - what's controlling the rise in CO2. And with longer and longer records, you can see more and more detail." Ralph Keeling's oxygen studies have shown that while more CO2 is being pumped into the atmosphere, land ecosystems are storing more of it than they were a couple of decades ago, he said. There are four main reasons, he said. Plants grow a little faster in an atmosphere with more CO2; a warming climate has extended growing seasons; some plants are using nitrogen from pollution and growing faster; and some previously cut forests have regrown. "It's as though the behavior of the planet is being slowly revealed in its fuller extent," he said. LASTING LEGACY Being the son of a famous scientist has been a bit of a burden for Ralph Keeling, but he said he's comfortable with his role, which includes seeing that the Mauna Loa data-gathering continues. And that is not as simple as taking measurements and recording numbers. Although a fair amount of the effort goes into collecting the next data point, much of the work involves trying to figure out what each reading means and whether it might have been biased in one way or another, he said. For example, a volcanic eruption or an equipment failure could skew the numbers. "We have to figure out how to make small corrections in order to make the data better," he said. "And that applies to the whole record. We're constantly trying to refine our understanding of what was done in the past and do things better now. If you're not doing that, things are probably sliding in the wrong direction." Peter Guenther, a Scripps researcher who worked with the elder Keeling beginning in the late '60s and now works with Ralph Keeling, said Charles David Keeling was determined and tenacious. "He was persistent, even stubborn, in pursuit of his scientific goal of understanding as much as possible about the natural cycle of CO2," said Guenther, who is responsible for maintaining Scripps' CO2 monitoring program. "The emphasis in his research was on establishing hard facts." Ralph Keeling understands the constant budget battles his father endured, starting in the early 1960s. In general, the research was funded by various federal agencies, which threatened to cut off funds at several points, sometimes for political reasons. In the 1970s, his father was competing with the National Oceanic and Atmospherics Administration. NOAA spun off a program that was designed to cover some of the same scientific territory. But the elder Keeling felt the agency wasn't properly equipped to monitor CO2. Funding battles continue today. "There has always been a danger it won't keep going," Ralph Keeling said. "It only kept going because he was there pushing it, and now because I'm there pushing it. I wish there was a way to put it on a footing where it didn't depend on a Keeling as much." At the moment, it looks like the measurements overlap with similar monitoring programs, Keeling said. He has been told that in the name of efficiency, the effort should be cut. "But there are issues there," he said. "One is, do you really think the government should have a monopoly on tracking changes in the climate? "We at Scripps are really the caretakers of the longest records. There's always a question of continuity and maintaining the quality so the records have a uniform value." Scripps director Haymet said global measurements the last three years are showing more rapid increases in CO2 levels than the United Nation's Intergovernmental Panel on Climate Change had expected. "We need to know how much time we have," Haymet said. "That's what these measurements tell us."
