Figure S1. - BioMed Central
advertisement

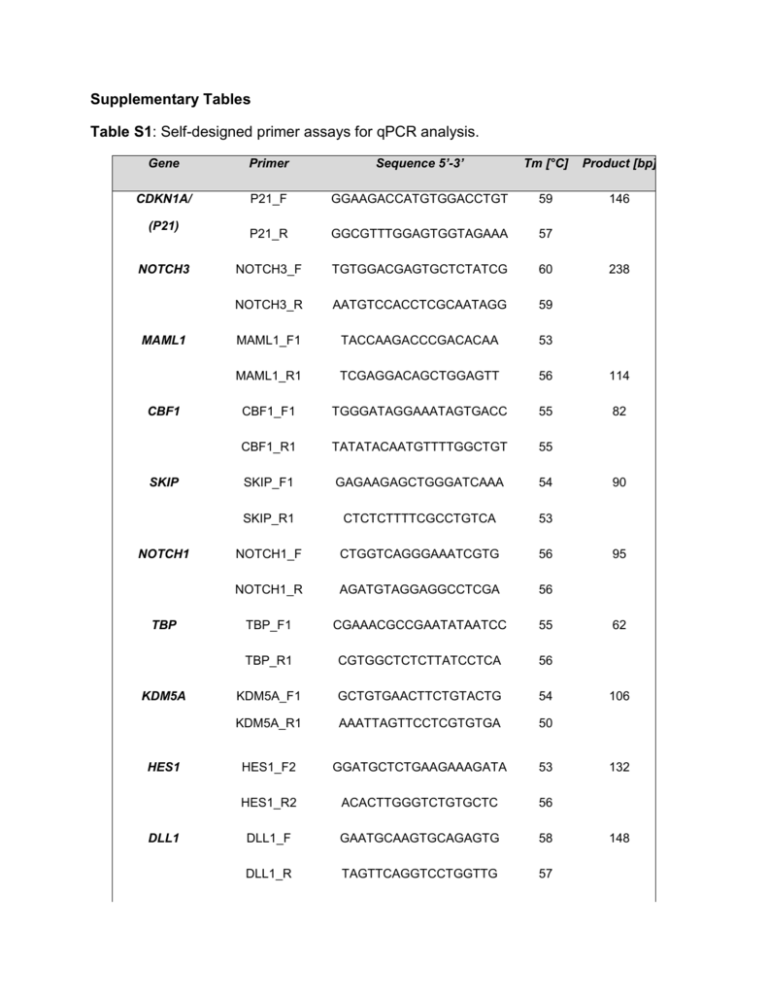
Supplementary Tables Table S1: Self-designed primer assays for qPCR analysis. Gene Primer Sequence 5’-3’ Tm [°C] Product [bp] CDKN1A/ P21_F GGAAGACCATGTGGACCTGT 59 146 P21_R GGCGTTTGGAGTGGTAGAAA 57 NOTCH3_F TGTGGACGAGTGCTCTATCG 60 NOTCH3_R AATGTCCACCTCGCAATAGG 59 MAML1_F1 TACCAAGACCCGACACAA 53 MAML1_R1 TCGAGGACAGCTGGAGTT 56 114 CBF1_F1 TGGGATAGGAAATAGTGACC 55 82 CBF1_R1 TATATACAATGTTTTGGCTGT 55 SKIP_F1 GAGAAGAGCTGGGATCAAA 54 SKIP_R1 CTCTCTTTTCGCCTGTCA 53 NOTCH1_F CTGGTCAGGGAAATCGTG 56 NOTCH1_R AGATGTAGGAGGCCTCGA 56 TBP_F1 CGAAACGCCGAATATAATCC 55 TBP_R1 CGTGGCTCTCTTATCCTCA 56 KDM5A_F1 GCTGTGAACTTCTGTACTG 54 KDM5A_R1 AAATTAGTTCCTCGTGTGA 50 HES1_F2 GGATGCTCTGAAGAAAGATA 53 HES1_R2 ACACTTGGGTCTGTGCTC 56 DLL1_F GAATGCAAGTGCAGAGTG 58 DLL1_R TAGTTCAGGTCCTGGTTG 57 (P21) NOTCH3 MAML1 CBF1 SKIP NOTCH1 TBP KDM5A HES1 DLL1 238 90 95 62 106 132 148 JAG1 JAG2 JAGGED1_F AGGACTATGAGGGCAAGAAC 58 JAGGED1_R AAATATACCGCACCCCTTC 54 JAGGED2_F CCTCTGCCTTGCTACAAT 62 JAGGED2_R GCACTCGTCGATGTTGAT 64 CK14_F GCGCACCATGCAGAACCTG 61 CK14_R CCTCCACGCTGCCAATCATC 61 CK5_F GATGATCCAGAGGCTGAGAG 62 CK5_R CTCGGCCAGCTTGTTCCTG 61 CK20_F GAACTGAGGTTCAACTAACG 62 CK20_R TGGCTAACTGGCTGCTGTAA 62 UPK2_F GACAGCCACTGAGTCCAGCA 64 UPK2_R AGCACCGTGATGACCACCAT 63 KRT14 KRT5 KRT20 UPK2 140 111 140 130 100 114 Table S2: Primer assays from Qiagen. The annealing temperature is 55°C for all Qiagen QuantiTect qPCR assays. Gene Assay Primer location product [bp] HEY1 QT00035644 Exon 4/5 126 NOTCH2 QT00072212 Exon 33/34 109 DLL3 QT00021791 Exon 2/3 111 DLL4 QT00081004 Exon 4-6 137 Table S3: Mutation status of Notch receptors (NOTCH1-4), Notch ligands (DLL1,3,4 and JAG1,2) and the ubiquitin ligase FBXW7 in urothelial cancer. This overview is based on the current TCGA study (http://cancergenome.nih.gov/). gene mutation frequency affected domain(s) DLL1 3/104 ECD (DSL Domain, EGF like) DLL3 2/104 All ECD (EGF like) DLL4 0/104 -- JAG1 4/104 All ECD (DSL Domain, EGF like) JAG2 2/104 All ECD (DSL Domain, EGF like) FBXW7 11/104 F-Box, WD40 NOTCH1 5/104 ECD (EGF like, LNR), NICD (poly-Val, polySer) NOTCH2 6/104 ECD (EGF like), NICD (ANK) NOTCH3 1/104 NICD/poly-Val region NOTCH4 2/104 ECD (EGF like) Abbreviations: ECD= extracellular domain; DSL= Delta Serate Lag; EGF= Epidermal Growth Factor; LNR= Lin Notch Repeats; ANK= ankyrin domain Table S4 Analysis of hN1ICD transfected cells The amount of N1ICD transfected cells and the number of aberrant cells changed slightly but not significantly throughout 72h of analysis. % NOTCH1 positive cells % NOTCH1 positive with aberrant nuclear phenotype BFTC905 6.5 +/- 2.1 50.6 +/-14.3 UM-UC3 11.6 +/- 6.6 44.4 +/-17.2 VM-Cub1 22.1 +/- 7.7 53.8 +/- 8.9 5637 28.5 +/-8.0 54.4 +/- 13.6 Supplementary figures Figure S1 Immunhistochemical staining of reference tissues. A. Positive nuclear and cytoplasmic NOTCH1 staining in a moderately differentiated (G2) adenocarcinoma and CIS high grade mammary carcinoma. B. JAG1 staining in the epithelium of normal gall bladder. C. Cytoplasmic staining of DLL1 in heart muscle cells. D. Smooth muscle cells in bladder as an internal positive control for DLL1 staining. NOTCH2 NOTCH1 UP 5637 UP 5637 BFTC905 639v BFTC905 639v DLL1 JAG1 UP 5637 UP 5637 BFTC905 639v BFTC905 639v Figure S2 Immunocytochemical staining of Notch receptors and ligands in a representative selection of urothelial cells (UP: cultured normal urothelial cells at low density, BFTC905: epithelial, from papillary UC, 5637: epithelial, from invasive UC, 639v: mesenchymal, invasive UC). NOTCH1 and JAG1 protein localization changed from a membrane-associated (papillary UC) to a diffuse cytoplasmic localization in invasive urothelial cancer cell lines. NOTCH2 protein was detectable in cytoplasm and in nuclei of papillary urothelial cancer cells. To better demonstrate the heterogeneous distribution of membrane, cytoplasmic and nuclear forms of DLL1 in the UC cell lines, pictures were not merged with DAPI staining.


