Appendix to the manuscript entitled “Application of the screening
advertisement

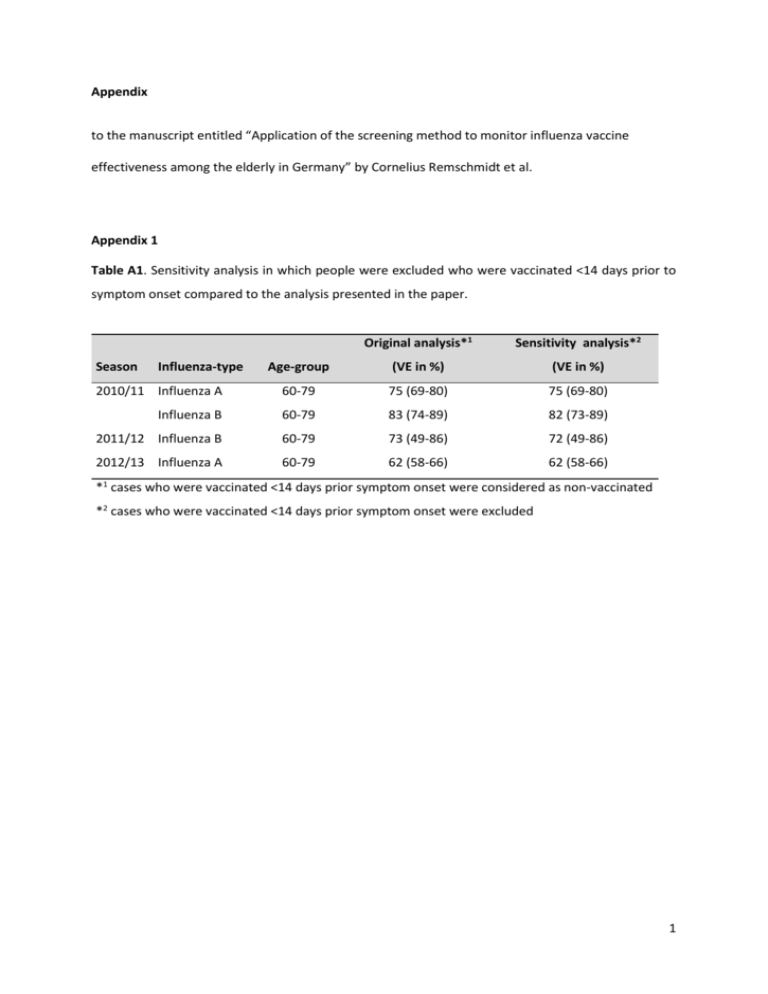
Appendix to the manuscript entitled “Application of the screening method to monitor influenza vaccine effectiveness among the elderly in Germany” by Cornelius Remschmidt et al. Appendix 1 Table A1. Sensitivity analysis in which people were excluded who were vaccinated <14 days prior to symptom onset compared to the analysis presented in the paper. Original analysis*1 Sensitivity analysis*2 Age-group (VE in %) (VE in %) 2010/11 Influenza A 60-79 75 (69-80) 75 (69-80) Influenza B 60-79 83 (74-89) 82 (73-89) 2011/12 Influenza B 60-79 73 (49-86) 72 (49-86) 2012/13 Influenza A 60-79 62 (58-66) 62 (58-66) Season Influenza-type *1 cases who were vaccinated <14 days prior symptom onset were considered as non-vaccinated *2 cases who were vaccinated <14 days prior symptom onset were excluded 1 Appendix 2 Table A2. Baseline characteristics of excluded vs. included cases, Germany, 2010/11-2012/13. Season 2010/11 Sex Male Age group 60-69 70-70 ≥ 80 Influenza strain A(H1N1)pdm A(H3N2) B not subtyped Hospitalized Yes Season 11/12 Sex Age group Influenza strain Hospitalized Season 12/13 Sex Age group Male 60-69 70-70 ≥ 80 A(H1N1)pdm A(H3N2) B not subtyped Yes Male 60-69 70-70 ≥ 80 Influenza strain A(H1N1)pdm A(H3N2) B not subtyped Hospitalized Yes * p-values for the chi-squared test Included cases N=1,174 n(%) 589 (59) 797 (68) 307 (26) 70 (6) 582 (60) 1 (<1) 251 (26) 137 (14) 455 (39) N=767 n(%) 306 (40) 263 (34) 268 (35) 237 (31) 12 (4) 118 (37) 97 (31) 89 (28) 317 (41) N=5,217 n(%) 2,440 (47) 2,485 (48) 1,736 (33) 996 (19) 859 (28) 168 (5) 1,267 (41) 806 (26) 2,060 (40) Excluded cases N=197 n(%) 111 (56) 135 (69) 51 (26) 11 (6) 106 (64) 1 (1) 44 (27) 15 (9) 81 (41) N=266 n(%) 101 (38) 71 (27) 73 (27) 122 (46) 4 (6) 35 (49) 18 (25) 15 (21) 115 (43) N=1,586 n(%) 778 (49) 648 (41) 518 (33) 420 (26) 252 (30) 36 (4) 332 (39) 231 (27) 679 (44) p-value* 0.11 0.97 0.16 0.59 p-value* 0.6 <0.01 0.25 0.59 p-value* 0.11 p<0.01 0.31 0.01 2 Appendix 3 Table A3 (online supplement). Sensitivity analysis assuming that vaccine coverage among excluded cases was 50% and 200% of vaccine coverage among included cases, respectively, compared to the analysis presented in the paper (“original analysis). Age-group (years) Season 2010/11 ≥ 60 Season 11/12 ≥ 60 Season 12/13 ≥ 60 VC among excluded cases VC among excluded cases considered 50% of VC of considered 200% of VC of Original analysis included cases included cases VE (%) VE (%) VE (%) 162/1,074 vacc. 176/1,371 vacc. 216/1,371 vacc. 80 (76-83) 81 (78-84) 76 (72-79) 208/767 vacc. 244/765 vacc. 353/767 vacc. 49 (39-57) 57 (51-63) 28 (19-37) 921/5,217 vacc. 1,061/6,803 vacc. 1,479/6,803 vacc. 64 (63-67) 69 (67-71) 54 (51-56) VE, vaccine effectiveness; VC, vaccination coverage; vacc., vaccinated 3 Appendix 4 Table A4. Sensitivity analysis comparing baseline characteristics of cases with exact date of vaccination vs. those without this information; Germany, 2010/11-2012/13. Season 2010/11 Sex Male Age group 60-69 70-70 ≥ 80 Influenza strain A(H1N1)pdm A(H3N2) B not subtyped Hospitalized Yes Season 11/12 Sex Age group Influenza strain Hospitalized Season 12/13 Sex Age group Male 60-69 70-70 ≥ 80 A(H1N1)pdm A(H3N2) B not subtyped Yes Male 60-69 70-70 ≥ 80 Influenza strain A(H1N1)pdm A(H3N2) B not subtyped Hospitalized Yes * p-values for the chi-squared test Cases with information on vaccination date n/N=122 (%) 56 (46) 83 (68) 32 (26) 7 (6) 69 (70) 1 (1) 16 (16) 12 (13) 36 (30) n/N=137 (%) 64 (47) 34 (24) 43 (32) 60 (44) 1 (2) 31 (54) 10 (18) 15 (26) 49 (36) n/N=612 (%) 274 (45) 204 (33) 241 (39) 167 (27) 73 (26) 17 (6) 112 (40) 80 (28) 219 (36) Cases without information on vaccination date n/N=40 (%) 19 (48) 26 (65) 12 (30) 2 (5) 23 (62) 0 12 (32) 2 (5) 17 (43) n/N=70 (%) 20 (29) 10 (14) 30 (43) 30 (43) 0 21 (64) 5 (15) 7 (21) 18 (28) n/N=305 (%) 124 (41) 93 (30) 129 (43) 83 (27) 41 (23) 28 (16) 66 (37) 42 (24) 120 (40) p-value* 0.86 0.89 0.14 0.13 p-value* 0.01 0.13 0.76 0.14 p-value* 0.24 0.63 0.01 0.27 4 Appendix 5 Table A5. Sensitivity analysis, assuming that 50% of cases without information on exact date of vaccination are considered as non-vaccinated. Vaccine effectiveness (%) against all influenza types. Age-group (years) Season 2010/11 All age-groups ≥ 60 Season 11/12 All age-groups ≥ 60 Season 12/13 All age-groups ≥ 60 Original analysis assuming Sensitivity analysis assuming cases without information on exact 50% of cases without information date of vaccination considered on exact date of vaccination vaccinated considered non-vaccinated VE (%) VE (%) 162 vacc./ 1,022 non-vacc. 142 vacc./ 1,042 non-vacc. 80 (76-83) 83 (65-73) 208 vacc./ 559 non-vacc. 173 vacc./ 594 non-vacc. 49 (39-57) 60 (53-66) 921 vacc./4,296 non-vacc. 769 vacc./ 4,448 non-vacc. 64 (63-67) 71 (69-73) VE, vaccine effectiveness; vacc., vaccinated 5


