Statistical_Differences_Between_CNTRL_WRF_and_Kiran
advertisement
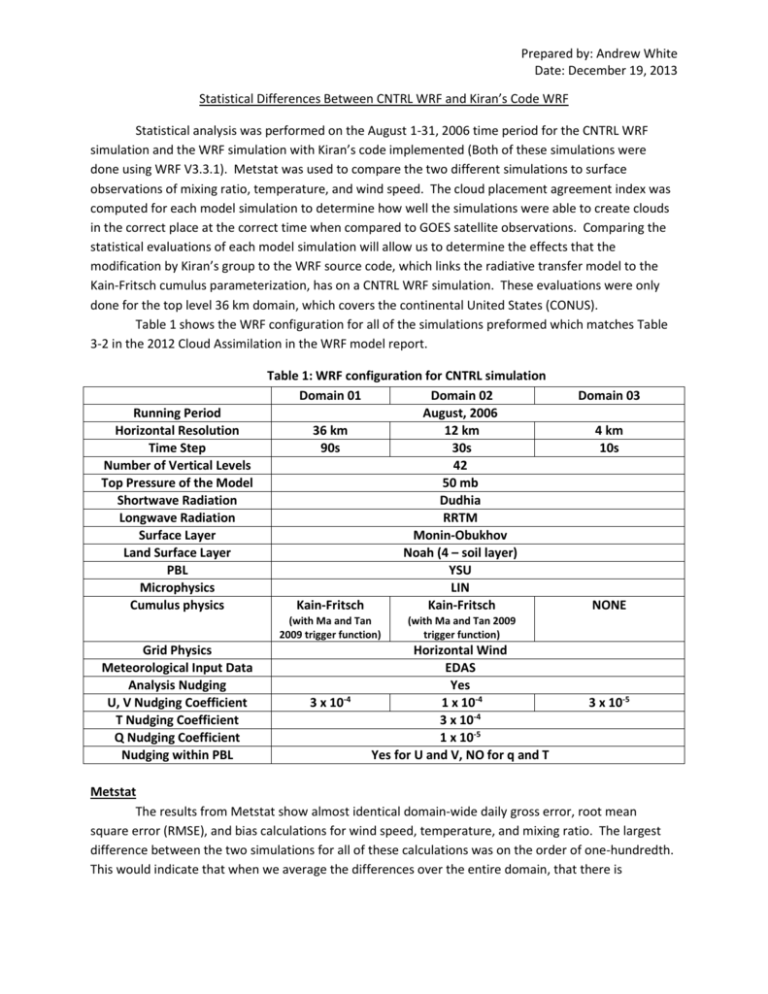
Prepared by: Andrew White Date: December 19, 2013 Statistical Differences Between CNTRL WRF and Kiran’s Code WRF Statistical analysis was performed on the August 1-31, 2006 time period for the CNTRL WRF simulation and the WRF simulation with Kiran’s code implemented (Both of these simulations were done using WRF V3.3.1). Metstat was used to compare the two different simulations to surface observations of mixing ratio, temperature, and wind speed. The cloud placement agreement index was computed for each model simulation to determine how well the simulations were able to create clouds in the correct place at the correct time when compared to GOES satellite observations. Comparing the statistical evaluations of each model simulation will allow us to determine the effects that the modification by Kiran’s group to the WRF source code, which links the radiative transfer model to the Kain-Fritsch cumulus parameterization, has on a CNTRL WRF simulation. These evaluations were only done for the top level 36 km domain, which covers the continental United States (CONUS). Table 1 shows the WRF configuration for all of the simulations preformed which matches Table 3-2 in the 2012 Cloud Assimilation in the WRF model report. Running Period Horizontal Resolution Time Step Number of Vertical Levels Top Pressure of the Model Shortwave Radiation Longwave Radiation Surface Layer Land Surface Layer PBL Microphysics Cumulus physics Table 1: WRF configuration for CNTRL simulation Domain 01 Domain 02 August, 2006 36 km 12 km 90s 30s 42 50 mb Dudhia RRTM Monin-Obukhov Noah (4 – soil layer) YSU LIN Kain-Fritsch Kain-Fritsch (with Ma and Tan 2009 trigger function) Grid Physics Meteorological Input Data Analysis Nudging U, V Nudging Coefficient T Nudging Coefficient Q Nudging Coefficient Nudging within PBL 3 x 10⁻⁴ Domain 03 4 km 10s NONE (with Ma and Tan 2009 trigger function) Horizontal Wind EDAS Yes 1 x 10⁻⁴ 3 x 10⁻⁴ 1 x 10⁻⁵ Yes for U and V, NO for q and T 3 x 10⁻⁵ Metstat The results from Metstat show almost identical domain-wide daily gross error, root mean square error (RMSE), and bias calculations for wind speed, temperature, and mixing ratio. The largest difference between the two simulations for all of these calculations was on the order of one-hundredth. This would indicate that when we average the differences over the entire domain, that there is [Type text] practically no difference between the two simulations. Figure 1 shows the wind speed, temperature, and mixing ratio RMSE results. Figure 1: Wind speed (top), temperature (middle), and mixing ratio (bottom) RSME domain wide daily average for CNTRL and Kiran WRF simulations for the month of August 2006. [Type text] From Figure 1 and 2, it can be seen that the domain RMSE and bias differences are very small to nonexistent between the two simulations for all three variables. For wind speed RMSE was found to be the same on every day except 8/29 where the use of Kiran’s code increased the RMSE slightly. The positive model bias for wind speed increased when Kiran’s code was use on 8/17 and 8/26 but was the same as the CNTRL simulation on the other days in August. The use of Kiran’s code does show some very slight improvements for temperature for a few days, where the RMSE is reduced and some of the negative temperature bias is reduced in the model as well. The results show that the mixing ratio RMSE is only different on two days (8/06, 8/12), while the model mixing ratio bias is different on seven days (8/02, 8/05, 8/06, 8/09, 8/11, 8/20, 8/23). Unlike with temperature, Kiran’s code does not show a reduction in RMSE or bias for every day in which the two simulations are different, but rather improves bias and error for only a few days. Overall, these statistical changes between the original WRF V3.3.1 and Kiran’s modified WRF V3.3.1 are shown to be extremely small on domain wide daily averages. This is not that unexpected, as Kiran’s modifications take place on the sub-grid scale in locations where convection is present. The areal coverage of convection on any given day is extremely small across the CONUS region, and therefore, the overall statistical effect of these locations would be expected to be small, and is verified with our results. [Type text] Figure 2: Wind speed (top), temperature (middle), and mixing ratio (bottom) model bias domain wide daily average for CNTRL and Kiran WRF simulations for the month of August 2006. Agreement Index The cloud agreement index (AI) calculates how well the model does at producing clouds in the correct place and at the correct time when compared to GOES satellite observations. The AI was calculated for each hour in the range 15:00-22:00 GMT in August 2006. The time range was chosen to ensure maximum daylight coverage across the domain so that GOES observations are available. The hourly AIs were then averaged to produce the daily AI. For the AI calculation a cloud albedo threshold can be set. Once this threshold is met the grid cell is considered to be cloudy. To further compare the results of the use of Kiran’s code the AI is computed with two different cloud albedo thresholds of 2 and 15%. The lowering of the threshold should make it easier to distinguish the impact of sub-grid clouds. The daily AI with a 2% threshold is shown in Figure 3 and the daily AI with a 15% threshold is shown in Figure 4. Figures 3 and 4 show that there are slight differences in AI over the August 2006 time period, and generally, the use of Kiran’s code tends to produce a slightly better AI for most days. However, these differences are still small with a maximum difference of two-tenths of a percent. The differences in AI between Kiran’s code and the CNTRL simulation do not show a significant difference even when the cloud albedo threshold was reduced to 2% from 15%. Rather, it appears that for both cases the AI is reduced by the same amount keeping their daily AI differences approximately the same. The difference in AI for the 15% cloud albedo threshold for each day is shown in Figure 5. The maximum difference in AI is found to occur on August 2nd, and therefore, Figure 6 shows the hourly distribution for AI. On this day, the AI is greater for every hour in the time period when Kiran’s code is used. However, the maximum difference is still less than a half of a percent. In fact, the maximum calculated hourly difference over the entire month was found to be a half of a percent. Like with the Metstat results, the AI is still takes into account the entire domain within the calculation, and therefore, the domain average difference can be highly resistant to changes on the small scale. This indicates that even though there are differences between the CNTRL simulation and a WRF simulation using Kiran’s code, they do not appear to be significant enough to change a domain wide average when the domain is over a large area like the CONUS region. [Type text] Agreement Index [2% Cloud Albedo Threshold] 0.7500 0.7300 Agreement Index 0.7100 0.6900 0.6700 0.6500 Kiran 0.6300 cntrl 0.6100 0.5900 0.5700 8/31 8/29 8/27 8/25 8/23 8/21 8/19 8/17 8/15 8/13 8/11 8/9 8/7 8/5 8/3 8/1 0.5500 Day Figure 3: Daily agreement index for CNTRL and Kiran WRF simulations over August 2006. Using a 2% cloud albedo threshold. Agreement Index [15% Cloud Albedo Threshold] 0.7900 Agreement Index 0.7700 0.7500 0.7300 Kiran 0.7100 cntrl 0.6900 8/31 8/29 8/27 8/25 8/23 8/21 8/19 8/17 8/15 8/13 8/11 8/9 8/7 8/5 8/3 8/1 0.6700 Day Figure 4: Daily agreement index for CNTRL and Kiran WRF simulations over August 2006. Using a 15% cloud albedo threshold. [Type text] Difference in Agreement Index (Kiran CNTRL) 0.0025 0.0015 0.0010 0.0005 8/31 8/29 8/27 8/25 8/23 8/21 8/19 8/17 8/15 8/13 8/11 8/9 8/7 8/5 -0.0005 8/3 0.0000 8/1 Difference Agreement Index 0.0020 -0.0010 -0.0015 -0.0020 Day Figure 5: Difference between CNTRL and Kiran WRF simulations for daily agreement index over August 2006. (15% Cloud Albedo Threshold) Kiran vs Cntrl Agreement Index 0.8 0.795 0.79 Agreement Index 0.785 0.78 0.775 Kiran 0.77 cntrl 0.765 0.76 0.755 22 21 20 19 18 17 16 15 0.75 Hour (GMT) on August 2, 2006 Figure 6: August 2, 2006 hourly agreement index comparison. (15% Cloud Albedo Threshold) [Type text] Insolation Differences Due to the fact that the modifications of Kiran’s group occur on the small scale, it becomes more beneficial to analyze plots of insolation for the two simulations. It is also of great use to create insolation difference plots that will show where the modifications to the received insolation at the surface occur. The AI was used to determine which time periods to analyze the insolation differences for. The greatest daily AI difference was found to occur on August 2, 2006, while the greatest hourly AI difference was found to occur on August 18, 2006 at 15:00 GMT. Therefore, these two time periods were chosen for analysis. For August 2, 2006, the two hours which had the greatest AI difference were 18 and 22 GMT at .3 and .4 percent difference, respectively. The plot of solar insolation at 18 GMT on August 2nd for the two WRF simulations is shown in Figure 7. [Type text] Figure 7: August 2, 2006 - 18 GMT. Insolation plots for CNTRL (top), Kiran (middle). Insolation difference between CNTRL and Kiran WRF simulation (bottom) [Type text] From the insolation difference plot we can see that the majority of the insolation differences occurred off the West Coast of the U.S. over the Pacific Ocean. Some off the differences in insolation were large, and approached 700 W m-2. The Southeast U.S., mainly over Alabama, also had areas of large insolation differences between the two WRF simulations. For 22 GMT on August 2nd the results are similar (Figure 8). [Type text] Figure 8: August 2, 2006 - 22 GMT. Insolation plots for CNTRL (top), Kiran (middle). Insolation difference between CNTRL and Kiran WRF simulation (bottom) [Type text] Over most of the domain, we see that the difference in insolation is minimal, with just a few locations of significant differences. On August 18th at 15:00 GMT, the time of the largest hourly difference in the AI of 0.5%, the plots of insolation once again show similar results (Figure 9). This time, the majority of the insolation differences occur over the Atlantic Ocean and the Gulf of Mexico. Over the Continental U.S., there are only a few grid points that have significant insolation differences, and these mainly occur over southern Michigan. From the results of all the three difference times presented here, it appears that the use of Kiran’s code is the most effective over the oceans. [Type text] Figure 9: August 18, 2006 - 15 GMT. Insolation plots for CNTRL (top), Kiran (middle). Insolation difference between CNTRL and Kiran WRF simulation (bottom) [Type text] Conclusion The evaluation performed shows that there is little difference in domain-wide statistics when Kiran’s code is used to link the radiative transfer model to the Kain-Fritsch cumulus parameterization within WRF. These results appear to be reasonable because we would expect the changes to only take place on a small scale, and thus have little effect of domain wide averages. The use of Kiran’s code however, could lead to large improvements if individual grids were compared rather than domain wide comparisons.


