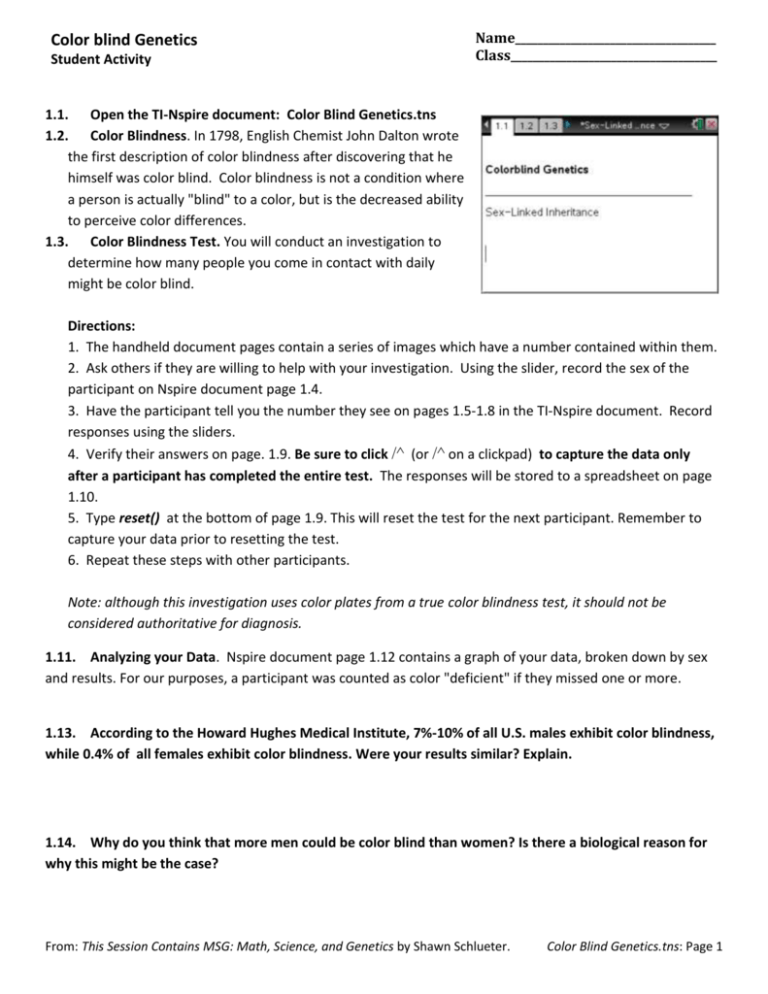
Color Blind Genetics Student Activity
advertisement

Color blind Genetics Student Activity Name____________________________________ Class_____________________________________ 1.1. Open the TI-Nspire document: Color Blind Genetics.tns 1.2. Color Blindness. In 1798, English Chemist John Dalton wrote the first description of color blindness after discovering that he himself was color blind. Color blindness is not a condition where a person is actually "blind" to a color, but is the decreased ability to perceive color differences. 1.3. Color Blindness Test. You will conduct an investigation to determine how many people you come in contact with daily might be color blind. Directions: 1. The handheld document pages contain a series of images which have a number contained within them. 2. Ask others if they are willing to help with your investigation. Using the slider, record the sex of the participant on Nspire document page 1.4. 3. Have the participant tell you the number they see on pages 1.5-1.8 in the TI-Nspire document. Record responses using the sliders. 4. Verify their answers on page. 1.9. Be sure to click /^ (or /^ on a clickpad) to capture the data only after a participant has completed the entire test. The responses will be stored to a spreadsheet on page 1.10. 5. Type reset() at the bottom of page 1.9. This will reset the test for the next participant. Remember to capture your data prior to resetting the test. 6. Repeat these steps with other participants. Note: although this investigation uses color plates from a true color blindness test, it should not be considered authoritative for diagnosis. 1.11. Analyzing your Data. Nspire document page 1.12 contains a graph of your data, broken down by sex and results. For our purposes, a participant was counted as color "deficient" if they missed one or more. 1.13. According to the Howard Hughes Medical Institute, 7%-10% of all U.S. males exhibit color blindness, while 0.4% of all females exhibit color blindness. Were your results similar? Explain. 1.14. Why do you think that more men could be color blind than women? Is there a biological reason for why this might be the case? From: This Session Contains MSG: Math, Science, and Genetics by Shawn Schlueter. Color Blind Genetics.tns: Page 1 Color blind Genetics Student Activity 2.1 Color Blindness. Color blindness can be inherited. It is most commonly inherited from mutations on the X chromosome. This results in the expression of the mutation more often in males than females. In fact, according to studies, about 7-10% of males, but 0.4% of females, express color blindness. 2.2 Explanation. One normal copy of a gene on the X chromosome is generally sufficient for normal function. Women who have the gene for color blindness on one of their two X chromosomes are protected by the normal copy of the same gene on the second chromosome. Males carry only one X chromosome. They lack the protection of multiple X chromosomes, since they have one X and one Y chromosome. 2.3 Directions. Use the sliders on page 2.5 to select a set of genotypes to cross. A cross is a mating between two organisms. As you change the sliders, look at the Punnett square and see how different crosses result in different possible genotypes for the offspring. Notice that one of the X chromosomes is marked differently. The X’ symbolizes an X chromosome with the color blind gene, as compared to just X, which is a normal X chromosome. 2.4 Genotype vs. Phenotype. Remember that color blindness is a sex-linked, recessive trait. This means it will only be expressed if there is no normal (dominant) X chromosome present (see page 2.2). In the Punnett square this means that the following genotypes would result in the following phenotypes: Color blind male: Normal male: 2.6. X’Y XY Color blind female: Normal female: X’X’ XX Carrier female: X’X (carries gene, not color blind) Which of the following crosses will result in all offspring being color blind? Circle all that apply. X’X x XY X’X’ x XY X’X x X’Y X’X’ x X’Y 2.7 Which of the following crosses will result all offspring to express color blindness OR be a carrier of the gene? Circle all that apply. X’X x XY X’X’ x XY X’X x X’Y X’X’ x X’Y 2.8. A woman who exhibits color blindness has children with a man who has normal vision. They have a boy. What is the probability he will be color blind? _________. 2.9. A woman who exhibits color blindness has children with a man who has normal vision. They have a girl. What is the probability she will be color blind? _________. 2.10 A woman who is a carrier for color blindness has children with a man who has normal vision. What is the probability that out of their offspring they have a girl, and that girl is a carrier for color blindness? _______ out of ________ (_______%). From: This Session Contains MSG: Math, Science, and Genetics by Shawn Schlueter. Color Blind Genetics.tns: Page 2 Color blind Genetics Student Activity 3.1. Probabilities in Populations. Now that we have an understanding of the role that inheritance has on color blindness, let’s look at the experimental probabilities of color blindness and compare that to theoretical probability. 3.2. Directions 1. Use the Punnett square tool on the page 3.3 to record the results of each possible cross using the spreadsheet on page 3.4. or the table on the following page. 2. Each cross will result in the follow possibilities: Color blind males, Color blind females, Normal (non-color blind) males Normal (non-color blind) females Females who are carriers 3. Complete these Punnett squares (You can use the Punnett square tool on the Nspire page 3.3 to help you): Cross 1: XX x XY Cross 2: X'X x XY Cross 3: X'X' x XY Cross 4: XX x X'Y Cross 5: X'X x X'Y Cross 6: X'X' x X'Y From: This Session Contains MSG: Math, Science, and Genetics by Shawn Schlueter. Color Blind Genetics.tns: Page 3 Color blind Genetics Student Activity 4. Record the number of each phenotype from the crosses in the table below: Category Cross 1 Cross 2 Cross 3 Cross 4 Cross 5 Cross 6 Subtotals Color blind Males Color blind Females Normal Males Normal Females Carrier Females Total 3.5. Compare the subtotal of color blind males to the total crosses made. Looking at all possible combinations (crosses), what is the probability of a male to be color blind? ______in__12___ (_____%) 3.6 Compare the subtotal of color blind females to the total crosses made. Looking at all possible combinations (crosses), what is the probability of a female to be color blind? ______in__12___ (_____%) 3.7 Now consider the research mentioned previously that indicates in America 7%-10% of all males are color blind, and about 0.4% of all females are color blind. How does this compare to the probabilities you determined from your Punnett squares? 3.8 What might be some of the factors that are causing a difference in the probabilities we expect and those that we see in the population? From: This Session Contains MSG: Math, Science, and Genetics by Shawn Schlueter. Color Blind Genetics.tns: Page 4


