Student School Food Survey Pilot Findings (Word doc)
advertisement
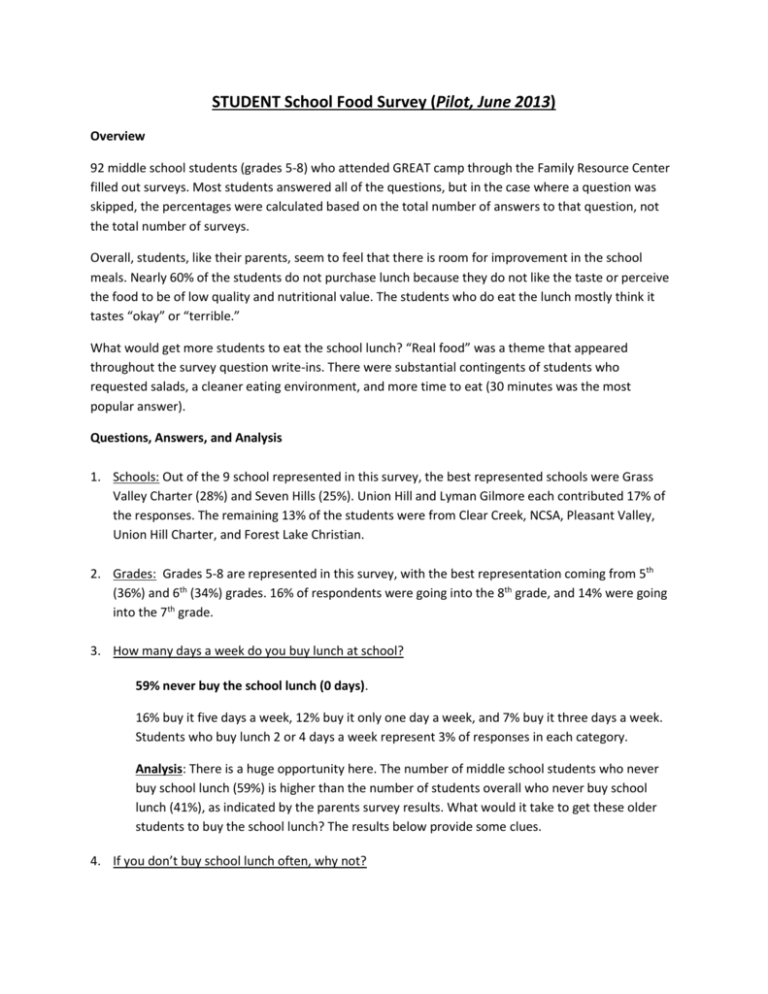
STUDENT School Food Survey (Pilot, June 2013) Overview 92 middle school students (grades 5-8) who attended GREAT camp through the Family Resource Center filled out surveys. Most students answered all of the questions, but in the case where a question was skipped, the percentages were calculated based on the total number of answers to that question, not the total number of surveys. Overall, students, like their parents, seem to feel that there is room for improvement in the school meals. Nearly 60% of the students do not purchase lunch because they do not like the taste or perceive the food to be of low quality and nutritional value. The students who do eat the lunch mostly think it tastes “okay” or “terrible.” What would get more students to eat the school lunch? “Real food” was a theme that appeared throughout the survey question write-ins. There were substantial contingents of students who requested salads, a cleaner eating environment, and more time to eat (30 minutes was the most popular answer). Questions, Answers, and Analysis 1. Schools: Out of the 9 school represented in this survey, the best represented schools were Grass Valley Charter (28%) and Seven Hills (25%). Union Hill and Lyman Gilmore each contributed 17% of the responses. The remaining 13% of the students were from Clear Creek, NCSA, Pleasant Valley, Union Hill Charter, and Forest Lake Christian. 2. Grades: Grades 5-8 are represented in this survey, with the best representation coming from 5th (36%) and 6th (34%) grades. 16% of respondents were going into the 8th grade, and 14% were going into the 7th grade. 3. How many days a week do you buy lunch at school? 59% never buy the school lunch (0 days). 16% buy it five days a week, 12% buy it only one day a week, and 7% buy it three days a week. Students who buy lunch 2 or 4 days a week represent 3% of responses in each category. Analysis: There is a huge opportunity here. The number of middle school students who never buy school lunch (59%) is higher than the number of students overall who never buy school lunch (41%), as indicated by the parents survey results. What would it take to get these older students to buy the school lunch? The results below provide some clues. 4. If you don’t buy school lunch often, why not? 28% of students do not like the taste of the menu items offered. 25% cited Poor food quality/nutritional value TIE (13%): Too few menu choices/ Meal costs too much 11% Portions are too small 7% Cafeteria line is too long Analysis: Students voted very similarly to the parents in this question for the top two answers. Unlike the parents, students also cited portions being too small and the cafeteria line being too long as less important reasons for not buying lunch. 5. In general, how would you rate the taste of the cafeteria food? Mark one. 34% of students surveyed do not eat the school lunch. Of the remaining 66% who do eat it: 45% rated it “Okay” 32% rated it “Terrible” 18% rated it “Pretty Good” 5% rated it “Delicious” If 77% of the students who gave the school lunch a rating consider it Terrible or Okay, there is room for improvement. 6. What is your favorite thing about the school lunches? A third (33%) of the students who answered this question wrote “Nothing”. And yes, chicken tenders did make an appearance. Two students (3% of those who answered this question) claimed this most popular menu item as their favorite part of school lunch. 2-3 students (3-4%) answered fruit, salad, veggies, and pizza, but the most popular answer (12% of the write-ins) after “nothing” was some form of sweets (dessert, cookies, donuts, Jell-O, etc.). There were also a few write-ins from kids who are simply thankful to be eating: “It keeps you from getting hungry” and “eating” are two such answers. 7. If the cafeteria could change one or two things to make the food tastier, healthier, or more interesting, what would you suggest? Be as specific as you can: The most common words in the write-in answers were: “real” (appeared in 15% of the write-in answers) “salad” (12%) “healthier” (11%) “More choices,” “bigger portions,” and “fresh” each appeared in 7% of the answers. Analysis: These kids want real food – fresh, healthy salads and other foods. 8. If you could add new menu items to the lunch menu, what would they be? Of the 70 kids who wrote an answer to this question, 21% of them wanted to add “salad” to the menu (compared to 33%of the parents who had the same suggestion). And, just so we know they were being honest, the next most popular student write-in at 11% was some form of sweets (ice cream, cookies, brownies), followed by pizza at 10%. A few kids got specific about their brand, requesting Subway sandwiches and Little Caesar’s pizza. Analysis: Judging from the response to this question and the next (#9), there is a small group of students who would like to see salad bars or at least more salad options at school. A pilot salad bar (e.g.: one day a week) would give us more information about how students would respond to an actual salad bar at school. 9. If a salad bar were available at your school, would you purchase a salad? Absolutely (25%) Maybe (22%) Depends (20%) No Way (19%) Probably (14%) Analysis: The students’ answers reflected the parents’ answers about salad bars, but with less enthusiasm. While just over half of parents said “absolutely” or “probably”, only 39% of students voted this positively. And just about the same amount (a combined 41%) voted “maybe” or “no way”, indicating that they are unlikely to purchase a salad. 10. What could be done to reduce the waste associated with school lunches? Students got creative with this answer, with ideas that ranged from sensible: “Have kid volunteers from each class make sure everyone recycles” “Real silverware and plates and having food fresh” “You could have a garden at your school and biodegradable food goes in it” “Have a table to put the leftover food on” To draconian: “No one is allowed to leave the gym until it's spotless” “If the kids don't eat their vegetables I would just keep giving them vegetables” However, three themes emerged: A full quarter of the students who answered this question feel that the food is the problem. 25% of the students wrote “better/healthier/real food.” 15% suggested “recycling” 10% of the students suggested a reduction in plastic and packaging 11. Have you heard of Harvest of the Month? No (68%) Yes (32%) Where? Of the 27 respondents who have heard of Harvest of the Month, 74% of them said that they heard about it at school or from their teacher, and another 15% mentioned the school lunch menu as the source. A few students mentioned specific teachers or their “fitness teacher.” Analysis: Only a third of the 92 middle school students surveyed have heard of this program. There is a gap. 12. How much time do you have to eat lunch at school? 20 minutes (37%) I don’t know (29%) 30 minutes (17%) 40 minutes (12%) Four students also filled in their own answers for this one, indicating that they have less than 20 minutes to eat. 13. How much time do you need to have for an enjoyable dining experience? 30 minutes (34%) 20 minutes (33%) 50 minutes (21%) 40 minutes (13%) Analysis: Students seem less concerned than their parents about having enough time to eat. 30 minutes was the top answer among both groups surveyed, with 55% of parents and 34% of students voting for this time period. However, the next most popular answer for parents was 40 minutes, while a full third of middle school students surveyed are happy with only 20 minutes of eating time. 14. In addition to the food itself, what changes (for instance in the lunchroom) would improve the overall dining experience? Student suggestions for improving their dining experience were all over the map. The most frequent request was a cleaner environment, with 19% of the students who answered this question making this request. The next most popular suggestion was to add entertainment in some form (11%), from “movies,” to “dancers,” to “America’s Got Talent Live.” Other suggestions that appeared more than once were in the areas of: Getting to sit wherever you want (7%) A quieter environment (7%) More space/tables (6%) Better smell (4%) Better line management (4%) Real silverware and plates (4%) Nicer staff (4%) 15. How many cans/bottles/glasses of the following do you drink on a typical day? We have rated the drinks below in order of popularity (high to low), with the average number of glasses/cans/bottles consumed daily for each one in parentheses: Type of Drink Water 100% Juice Other Juice Drink Regular Soda Other Sweetened Drink Sports Drink Energy Drink Average # Glasses Consumed per Day 3.2 1.1 1.1 .7 .5 .5 .4 Percent Who Consume This Type of Drink Every Day 95% 63% 41% 40% 35% 31% 21% Diet Soda .2 12% In the “Other Sweetened Drink” category, almost half of the respondents wrote in “tea.” “lemonade”, “Kool-Aid”, “milk”, and “protein shake” comprised the rest of the answers. Students are overwhelming choosing to drink water as their primary beverage. Nearly all the students surveyed reported drinking water on a daily basis, and drinking an average of more than three glasses per day. When looking at the students as a whole, they drink slightly less than one regular soda a day. However for those students who drink soda every day, that number jumps to almost two sodas per day. Few students in this age group drink diet soda, but nearly a quarter are drinking part of an energy drink each day. For those who do drink energy drinks, which are high in sugar but also in caffeine, they report drinking nearly two drinks per day. 16. How many times in the last week did you exercise or participate in physical activity for at least 20 minutes (including basketball, soccer, jogging, dancing, etc.)? Exercised more than 7 times Exercised 4 times Exercised 3 times Exercised 2, 5, or 6 times Exercised 0 times Exercised 1 time Exercised 7 times 32% of respondents 20% of respondents 13% of respondents TIE: 9% of respondents (in each category) 4% 3% 1% A third of the students surveyed report that they exercise for at least twenty minutes every day. An impressive eighty-four percent report exercising at least three times a week. Only seven percent of student report that they get hardly any exercise, getting twenty minutes or less of vigorous exercise per week. Was there anything you found confusing or didn’t understand about this survey? 14% (13 of the 92) students surveyed did not understand something about the survey. Four respondents simply wanted to know why they were being asked about school lunch. Three students found question 14 (how to improve the dining experience, aside from the food) confusing. Two students found question 10 (how to reduce waste) confusing. Appendix A: Additional Feedback School Grass Valley Charter Grade Answer 8 just more healthy foods Grass Valley Charter 7 work hard to give us healthy meals Pleasant Valley We should have real pizza and real meat. And yummy food 7 (totally different from now) Union Hill Our school has a garden but they never use it. I suggest they use 7 it for veggies. Parents can volunteer to help with it. Grass Valley Charter 6 make real food, not fake food Seven Hills 6 think that we should be allowed to have candy at school Seven Hills 6 I would like more tables Union Hill 6 make the lunches better Grass Valley Charter 5 the chicken tenders are like sponges Lyman Gilmore 5 the macaroni needs more salt
