Environmental EOC Study Guide 2015 answer key
advertisement
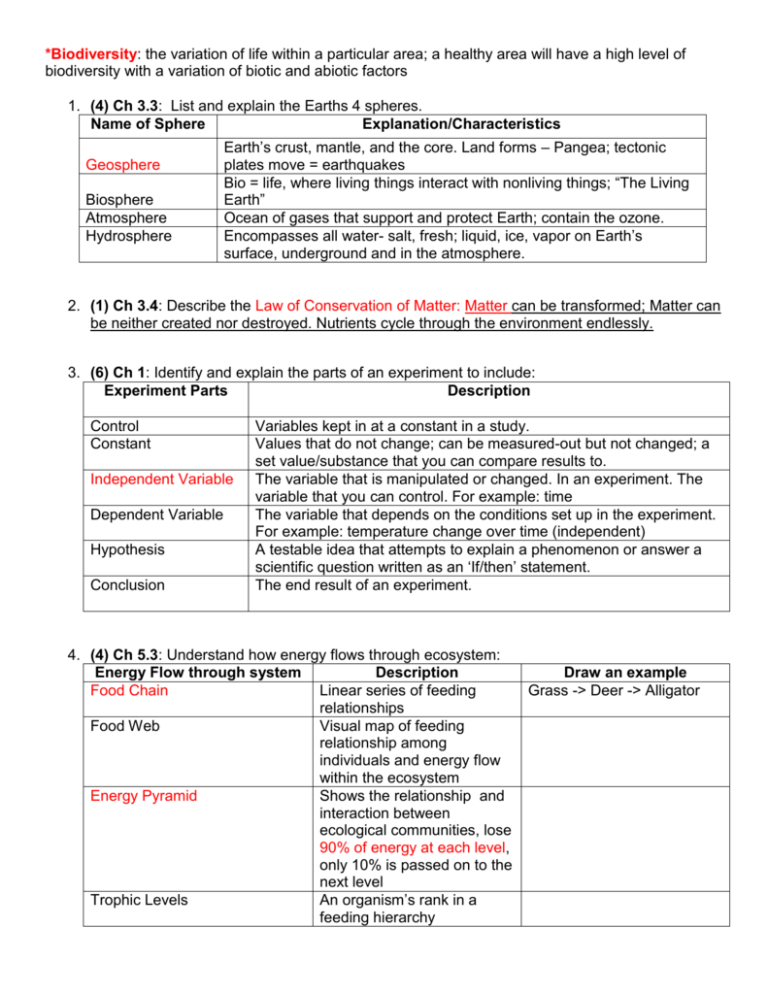
*Biodiversity: the variation of life within a particular area; a healthy area will have a high level of biodiversity with a variation of biotic and abiotic factors 1. (4) Ch 3.3: List and explain the Earths 4 spheres. Name of Sphere Explanation/Characteristics Geosphere Biosphere Atmosphere Hydrosphere Earth’s crust, mantle, and the core. Land forms – Pangea; tectonic plates move = earthquakes Bio = life, where living things interact with nonliving things; “The Living Earth” Ocean of gases that support and protect Earth; contain the ozone. Encompasses all water- salt, fresh; liquid, ice, vapor on Earth’s surface, underground and in the atmosphere. 2. (1) Ch 3.4: Describe the Law of Conservation of Matter: Matter can be transformed; Matter can be neither created nor destroyed. Nutrients cycle through the environment endlessly. 3. (6) Ch 1: Identify and explain the parts of an experiment to include: Experiment Parts Description Control Constant Independent Variable Dependent Variable Hypothesis Conclusion Variables kept in at a constant in a study. Values that do not change; can be measured-out but not changed; a set value/substance that you can compare results to. The variable that is manipulated or changed. In an experiment. The variable that you can control. For example: time The variable that depends on the conditions set up in the experiment. For example: temperature change over time (independent) A testable idea that attempts to explain a phenomenon or answer a scientific question written as an ‘If/then’ statement. The end result of an experiment. 4. (4) Ch 5.3: Understand how energy flows through ecosystem: Energy Flow through system Description Food Chain Linear series of feeding relationships Food Web Visual map of feeding relationship among individuals and energy flow within the ecosystem Energy Pyramid Shows the relationship and interaction between ecological communities, lose 90% of energy at each level, only 10% is passed on to the next level Trophic Levels An organism’s rank in a feeding hierarchy Draw an example Grass -> Deer -> Alligator 5. (1) Ch 4.1: Make a VENN diagram to COMPARE/CONTRAST biotic and abiotic environmental factors. Biotic: living or once living Both: Abiotic: never living Ex: Plants, Animals, Fungi Make-up an ecosystem Ex: Temperature, Wind, pH 6. (5) Ch 4.1:Differentiate between the levels of ecological organization Ecological Organization Definition Example Species A group of individuals that dolphin interbreed and produce fertile offspring Population Group of the same species Pod of dolphin living in the same area at the same time Community All the populations in a Pod of dolphin with fish, turtles, particular area sharks, sea weed; kelp, algae (all biotic) Ecosystem All of the living things and their Community (Pod of dolphin with physical environments within a fish, turtles, sharks, sea weed; particular area kelp, algae) + abiotic: temperature, pH, rocks, nutrients Biosphere Where living things interact with All of the ecosystems on Earth nonliving things 7. (4) Ch 6.3: Compare the four types of wetlands: Wetland Description Freshwater Marshes Shallow water, tall grass-like plants (cattails) *Swamps Shallow water, rich in vegetation with woody shrubs and trees, few grasses Bogs Low nutrients, acidic pH of water, floating mats of vegetation, usually moss, result of secondary succession Fens Rich in nutrients, less acidic, connected to a source of groundwater 8. (5) Ch 5: Compare/contrast the 5 types of species interaction: Types of Description Species Interactions Predator/Prey Process by which an individual of one species hunts, captures and kills prey (+/-) Competition Occurs when organisms seek the same limited resource (-/-) Mutualism Two or more organisms benefit from sharing this relationship (+/+) Draw an Example Example Commensalism Parasitism Relationship in which one species benefits and the other is unaffected (+/0) One organisms depeds on the other for nourishment or some other benefit, one is harmed (+/-) 9. (3) Ch 6.2: Describe the unique characteristics of the major biomes and their occurrence to average temperature and precipitation (think latitude) Biome Description Average Average Latitude How would you describe to Temperature Precipitation someone who couldn’t see it?? Tropical Rain 12 hour days, dense canopy, trees, Warm; Very wet Around Forest vines, plants; nutrient rich tropical equator vegetation, not soil Tropical Dry Seasonal variations, dry and wet Warm Heavy rainy Just Forest season season with above/below a long dry the equator season Tropical region, with less rain than 20 degree C 40mm –dry Just Savanna tropical dry forest but more than a warm with a rainy above/below desert, “Tropical Grassland” season tropical dry forests Desert Dry area full of sand, rocks, little to HOT, can get VERY DRY, Found just no plants chilly/cold at little to no above night, 30 C rain- 25cm savanna Temperate Rain Damp, high humidity, surrounded 25 degree C, Very rainyJust above Forest by vegetation can be chilly 200-300 mm desert areas Temperate Seasons, broad leafy trees, forests, 25 C Moderate Found Forest abundant with variety of vegetation, Seasonal rain, 80above nutrient rich soil –deciduous trees variations 100mm temperate rain forest Temperate No big trees due to little rain, 23 C 30-50 mm – Found Grassland variety of tall grasses, deciduous little rain around flowers temperate forest areas Chaparral Highly seasonal; wet winters, dry 20 C 80mm Found summer; hills with shrubs around temperate grasslands Boreal Forest Coniferous trees; cool, dry region, 15 C 70mm Found in the ranges of tall pine needle trees: North “coniferous forest” Tundra Snowy, dry, cold area; can be 5 C, very 30mm Found mountainous, full of scrubby cold winters between vegetation; broad hoofed animals with mild boreal and with think fur summer near Poles, around polar ice caps Polar Ice Caps Very cold region, snow, ice, no Negative/LoC Little – snow poles Mountains plants at all Steep mountains, full of small and large trees Variation dependent on latitude and altitude Varies Makes up parts of many areas 10. (5)Ch 12.1: Explain various sustainable farming practices that reduce erosion. Sustainable Farming Type Description Shelter Belts “wind breaks”; rows of trees (other plants) planted along the edges of fields to slow the wind Conservation Tillage Turning over of soil before planting Intercropping Planting of different crops in a mixed arrangement Terracing Used on steep hillsides, transforms steep slopes into a series of steps Contour Farming Plowing sideways across a hillside, perpendicular to the hills slope 11. (3) Ch 12: Describe the factors that contribute to soil pollution Soil Description Pollutants Irrigation Providing water to plants; short-term: good; long-term: pollutes leading to erosion and increases salinization Salinization Build-up of salts in upper soil horizons; increased through irrigation Pesticides Chemicals that kill organisms that attack or compete with plants can kill plants, animals, fungus, bacteria or viruses 12. (3)Ch 19: List/describe the advantages and disadvantages of the various methods of hazardous waste disposal Hazard Description Advantages Disadvantages Waste Disposal Surface Shallow pit, lined with plastic, Reduce volume of Can crack and leak Impoundment used to hold liquid or semisolid hazardous waste wastes; only a hazardous wastes material temporary solution Sanitary A facility in which waste is Prevent contamination Expensive, uses a lot of Landfill buried in the ground or piled up of groundwater and soil space, can be seen in large, engineered mounds Deep Well A method of hazardous waste Out of sight, and away Pollutes aquifer Injection disposal in which the waste is from people (groundwater that can pumped into a well that has be used for drinking been drilled beneath the water water) table into porous rock 13. (1)Ch 19: What is Integrated Waste Management (IWM). A comprehensive solid waste program that emphasizes REDUCE, REUSE, RECYCLE; through prevention, recycling, composting and disposal program; Considers how to prevent, recycle, and manage solid waste in waste that promote human health and the environment. 14. (1) Ch 2: Explain how supply and demand effect the economy. The amount of a product offered for sale at a given price is supply. The amount of a product people will but at a given price if free to do so is demand. Working to equilibrium is best, however as the as the supply decreases and demand increases, so does the price. If the supply increases and the demand decreases, so does the price. 15. (3) Ch 18: Explain the positive and negative affect of the various forms of alternative energy Alternative Description Positive Effects Negative Effects Energy Nuclear Uranium is sued to generate Does not create air Very expensive to electricity without creating air pollution, safer for maintain; possible risk of pollution workers meltdown’s waste disposal Hydro Using the kinetic energy of Renewable energy; *drastically change moving water to turn turn-bines clean-nothing burns = ecosystems leading to a and generate electricity no air pollution, decrease in biodiversity inexpensive Wind Wind turn-bines convert wind’s Non-polluting; efficient Unpredictable supply; kinetic energy into electrical damage to landscape energy and wildlife Solar Using the sun’s energy directly Limitless supply Weather dependent’ for electricity expensive Biomass Energy produced from organic Releases no net carbon Biofuel crops take up material; ie: plants (wood/grain) into the atmosphere, land deforestation, and manure (animals/human economic benefits erosion, desertification, waste) not efficient; causes indoor air pollution Geothermal Steam or how water produced by Releases few May not be sustainable; pressure combining with the greenhouse gases; could run out of water; breakdown of radioactive reduces air pollution not available elements producing heat used to everywhere; may trigger turn turn-bines earthquakes 16. (1) Ch 14: Explain the causes and effects of *eutrophication in the ecosystem. Causes Effects The addition of phosphorus to bodies of water. Can lead to an overgrowth of producers (algae). Ex: *Farmers use of fertilizer to grow crops leads to a big contribution of phosphorus into the water. Extreme cases lead to hypoxia (extremely low levels of oxygen- Dead Zones) 17. (5) Ch 12: Explain the various components of soil formation to include Factor Effects *Climate *soil forms faster in warm, wet climates than in cold, dry climates Time Takes decades, centuries, millennia to form soil Structure A mixture of biotic and abiotic materials Parent Material Chemical and physical attributes of a parent material influence properties of soil formed from it Material with a carbon atom; living things/once living = biotic Organic Material 18. (5) Ch 12: Explain the characteristics of soil to include: Characteristic Description *Color Dark = rich in humus = rich in nutrients Pale = low in humus = poor nutrients *Size Determines the texture of the soil *Texture 3 particle sizes: *clay – silt – sand (mixture of these = loam) – know that clay is smallest, sand is largest; Indicates how porous soil is; determines the work ability (how easy it is to plant and harvest from) *Structure Describes the arrangement of soil; particles “clumpiness”; more clumpy = more humus = better soil for agriculture *pH Level of acidity – plants need slightly acidic/slightly alkaline soil in which to grow 19. (1) Ch 9: Make a VENN diagram to COMPARE/CONTRAST bioaccumulation with biomagnification. Bioaccumulation Organisms can build up large concentrations of toxic substances in their bodies Ex: DDT build-up in Fatty tissues Both Toxic chemicals accumulate in organisms as they feed on another *Biomagnification concentration of toxic substances can be greatly magnified with each step in the food chain Ex: DDT – more harm to tertiary predator because the concentration is greater 20. (5)Ch 13: Describe the advantages and disadvantages of the various types of mining to include Mining Description Advantages Disadvantages Type Open Pit Digging a large hole and Safer, Easier Leaves environmental removing the ore and unwanted disaster (strip mining) rock that surrounds ore Undersea Large machines vacuum sand Safe Expensive, difficult to and gravel from sea floor access (dredging) Mountain Forest clear-cut, burned, topsoil Easy Destroys environment Top removed, rock blasted by removing mountains; Removal expensive Placer Sifting through the material in Easy Time-consuming, Mining modern or ancient riverbed endangers wildlife (looking deposits ecosystems for gold) Subsurface (tunneling) Vertical shafts are dug deep into the ground, networks of tunnels Doesn’t destroy forests Dangerous to workers; expensive 21. (1) Ch 12: Describe the advantages/disadvantages of monoculture. Advantages Disadvantages Little variation in tree species and age = A plantation of large-scale plantings not as much habitat variety as in natural of a single crop forests = low biodiversity Even-aged rotation time; supply of a certain type of tree species TOTAL = 78 pts May 6th – May 8th 22. Ch 12: Explain the importance of industrial agriculture and the Green Revolution. Industrial technology (use of machines/technology in farming) was part of the Green Revolution, which gave developing countries a way to sustain themselves and feed their people. This lead to an increase in fossil fuel use to produce fertilizer and pesticides. 23. Ch 15-16: Make a Venn Diagram to Compare/contrast low-level and high-level ozone. Low – tropospheric, dangerous, due to vehicles and industry High – stratospheric, safe, natural process to warm the Earth Both- contain similar chemicals 24. Ch 14: Make a Venn Diagram Compare / contrast point and non-point pollution Point – distinct locations of pollution; ex: factories or sewer pipes Non-Point – comes from many places spread over a large area; ex: runoff produced by rain or snow, runoff from oil covered streets, runoff from agricultural fields Both: types of pollution sources 25. Ch 14: Explain why ground water (aquifer) pollution is difficult to clean up. Hidden from view and difficult to monitor; takes years to rid contaminants – better to prevent than clean-up; positive: permeable, allows water to cycle through naturally. 26. Ch 19: Explain the composition of municipal solid waste (trash). Paper products make-up the largest component of trash. Also includes yard debris, food scraps and plastic. 27. Ch 4: Compare the impact extirpation, extinction and mass extinction have on biodiversity Factor Effects on Biodiversity Impact Extirpation Disappearance of an organism from a particular area but not globally; does push organism towards extinction, further decreasing biodiversity. Extinction The disappearance of a species from the Earth; 99% of all species that once lived are now gone = decreases biodiversity Mass Extinction Many species become extinct at once; 5 worldwide extinctions in history, decreases biodiversity greatly 28. Ch 11: Describe resource management approaches to include Approach Effects on Resource Management Maximum Harvest the maximum amount of a resource without reducing the amount Sustainable Yield of future harvests Ecosystem Based Management Adaptive Management Harvest resources in ways that minimize impact on the ecosystems and ecological processing that provide resources Scientifically testing different management approaches in an area; one after the other, then customizing an approach based on the results 29. Ch 11: Explain why there is less biodiversity in a tree plantation than in a similar sized naturally occurring forest. A tree plantation is a large scale planting of a single crop of trees that are roughly the same age and size, unlike those in a natural forest. This leads to a lower biodiversity. ***Succession: the regrowth of a forest after a natural or man-made disaster; EX: after a mudslide, plants and animals will return to an area 30. CH 17/18: Using a VENN diagram Compare/contrast renewable with nonrenewable resources. Renewable: a resource that can be recycled or get more of; ex: soil, wind, solar Non-Renewable: a resource that once it is used, it is gone and cannot get more of it; EX: fossil fuels: oil, coal, natural gas 31. Ch 15/16: Understand various environmental laws/policies and agencies to include: Environmental Law/Policy NEPA EPA ESA What does the abbreviation represent? The National Environmental Policy Act Environmental Protection Agency Endangered Species Act Description Promotes enhancement of the environment, lead to the Environmental Impact Statement (EIS) Increase air quality and human health Helps to protect endangered species; no hunting/poaching/trading; no harming habitat; US Fish and Wildlife keeps a list and develops recovery plans 32. Ch 2: Explain the different approaches to environmental policies to include Approach Description Command A government body sets rules and threatens punishment for violations and Control Subsidy A give away of cash or public resources that is intended to encourage a particular activity or lower the price of a product Green Tax Taxes imposed on companies that participate in activities or produce products that are harmful to the environment Cap and Trade A government determines the overall amount of pollution it will accept for a specific pollutant and issues permits that allow polluters to emit a certain fraction of that amount 33. Ch 11: Compare the advantages and disadvantages of timber harvesting methods to include: Timber Description Advantages Disadvantages Harvesting Method Clear Cutting All trees in a certain area are Creates more lumber Reduces our oxygen cut down and destroys animal habitats, leads to erosion and evenaged regrowth of trees leading to decrease in biodiversity Seed Tree Small numbers of mature and Less harmful than Even-aged regrowth healthy seed-producing tress clear-cutting are left standing so they can reseed the logged area Shelter Wood Small number of trees are left in place to provide shelter for the seedlings as they grow Less harmful that clear cutting Even age regrowth Selection Systems Only some trees are cut at once Resembles a forest Dangerous to workers and expensive *Biodiversity: reduced by only planting one type of tree back into the ecosystem after clear-cutting. Ex: Clear cut the forest, only plant back spruce trees. 34. Ch 7: Differentiate between the three types of species diversity to include: Type Description Species Diversity The number or variety of species of a particular region Genetic Diversity The differences in DNA among individuals within species and populations Ecosystem Diversity The number and variety of ecosystems within a given area 35. Ch 7: What human activity results in the greatest loss of biodiversity? habitat change that leads to habitat loss, could be due to pollution, invasive species, overharvesting, or climate change 36. YOU NEED TO REMEMBER THIS: Cost effectiveness is the greatest factor in the development and implementation of alternative energy sources. 37. Ch 3: Identify and describe the biogeochemical cycles in the ecosystem to include: Biogeochemical Description Example Cycle Carbon Cycle How a carbon atom cycles through the Photosynthesis, cellular environment respiration. Sediments, ocean Nitrogen Cycle How nitrogen moves through the Important for DNA/RNA; environment – cannot cycle out of essential for plant growth biosphere on its own Hydrological How water cycles through the Evaporation/transpiration, Cycle environment condensation, precipitation Phosphorus How phosphorus cycles through the Keeps phosphorus Cycle environment availability low, overuse of fertilizer can lead to eutrophication 38. Ch 3: What is a carbon sink and provide examples: Description/Definition Carbon Sink Absorbs more carbon that it releases; roughly 1-2 billion metric tons of carbon unaccounted for, not returned to atmosphere or ocean Examples Taken in by the coniferous trees of the Boreal Froest (northern forests) 39. Ch 8: Explain the various population demographics to include: Population Description Example Demographics Population The number of individuals within a “how crowded it is”; Density population per unit area “how many people live in a square mile” Age Structure “Age Distribution”; describes the relative Can look at individuals who numbers of organisms of each age within make-up the prea population reproductive/reproductive/post reproductive populations Distribution How organisms are arranged within an Clumped, random or uniform Patterns area ****Demographic Transition 40. Ch 8: What is a Population Structure Histogram and how do you interpret it. A population structure histogram is describes the relative numbers of organisms of each age within a population. Use the population structure histogram above to answer the following questions: a. Which country has the SMALLEST percentage of adults reaching age 80? Congo b. Looking at the US, are there more females OR males over the age of 80? Females c. Does Germany or the US have a higher percentage of people age 0-4? US 41. Ch 12: How can biotechnology impact biodiversity? (think: cloning, selective breeding, GMOs) Negatively: by increasing land cultivation, population growth and other environmental pressures. Positively: cloning animals on the brink of extinction 42. Ch 5: How does natural selection and evolution impact the biodiversity of an ecosystem? (think: genetic changes) The biodiversity decreases because the ‘most fit’ out compete and out-live the ‘less fit’. *HINT: Try to study 10 of these questions each night to help increase your EOC grade!

