- Pathways Project
advertisement
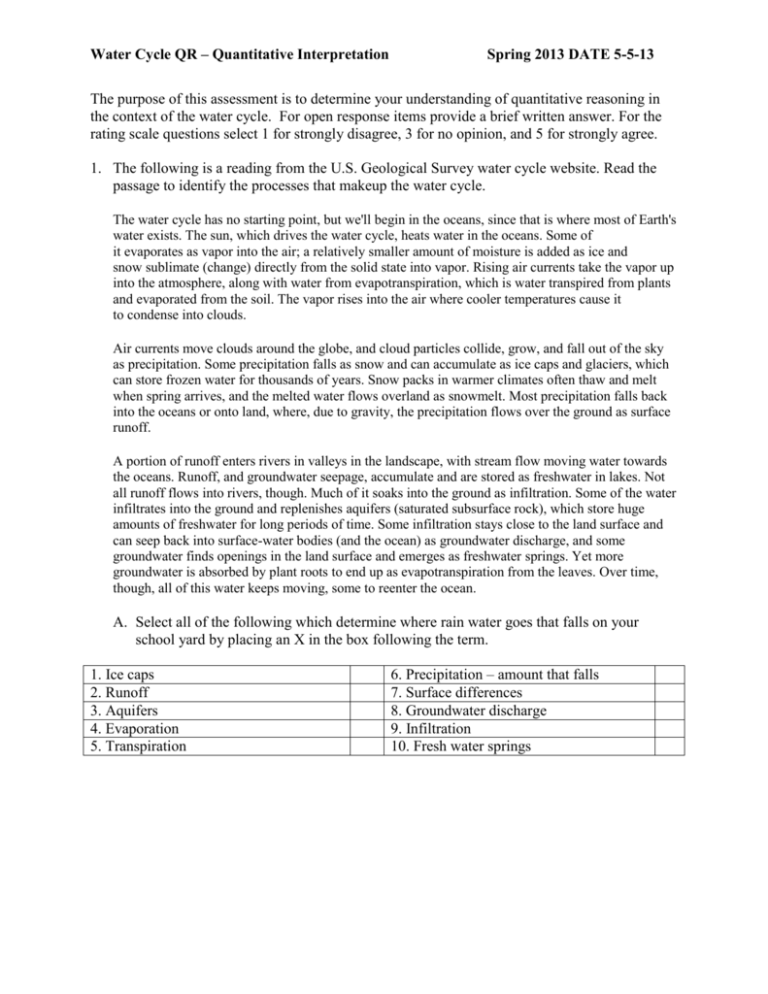
Water Cycle QR – Quantitative Interpretation Spring 2013 DATE 5-5-13 The purpose of this assessment is to determine your understanding of quantitative reasoning in the context of the water cycle. For open response items provide a brief written answer. For the rating scale questions select 1 for strongly disagree, 3 for no opinion, and 5 for strongly agree. 1. The following is a reading from the U.S. Geological Survey water cycle website. Read the passage to identify the processes that makeup the water cycle. The water cycle has no starting point, but we'll begin in the oceans, since that is where most of Earth's water exists. The sun, which drives the water cycle, heats water in the oceans. Some of it evaporates as vapor into the air; a relatively smaller amount of moisture is added as ice and snow sublimate (change) directly from the solid state into vapor. Rising air currents take the vapor up into the atmosphere, along with water from evapotranspiration, which is water transpired from plants and evaporated from the soil. The vapor rises into the air where cooler temperatures cause it to condense into clouds. Air currents move clouds around the globe, and cloud particles collide, grow, and fall out of the sky as precipitation. Some precipitation falls as snow and can accumulate as ice caps and glaciers, which can store frozen water for thousands of years. Snow packs in warmer climates often thaw and melt when spring arrives, and the melted water flows overland as snowmelt. Most precipitation falls back into the oceans or onto land, where, due to gravity, the precipitation flows over the ground as surface runoff. A portion of runoff enters rivers in valleys in the landscape, with stream flow moving water towards the oceans. Runoff, and groundwater seepage, accumulate and are stored as freshwater in lakes. Not all runoff flows into rivers, though. Much of it soaks into the ground as infiltration. Some of the water infiltrates into the ground and replenishes aquifers (saturated subsurface rock), which store huge amounts of freshwater for long periods of time. Some infiltration stays close to the land surface and can seep back into surface-water bodies (and the ocean) as groundwater discharge, and some groundwater finds openings in the land surface and emerges as freshwater springs. Yet more groundwater is absorbed by plant roots to end up as evapotranspiration from the leaves. Over time, though, all of this water keeps moving, some to reenter the ocean. A. Select all of the following which determine where rain water goes that falls on your school yard by placing an X in the box following the term. 1. Ice caps 2. Runoff 3. Aquifers 4. Evaporation 5. Transpiration 6. Precipitation – amount that falls 7. Surface differences 8. Groundwater discharge 9. Infiltration 10. Fresh water springs Water Cycle QR – Quantitative Interpretation Spring 2013 DATE 5-5-13 B. Provide a sentence or two that explains the characteristics of evaporation and how it impacts water movement. (QA variable attributes) C. How is evaporation measured? (QA variable measure) Water Cycle QR – Quantitative Interpretation Spring 2013 DATE 5-5-13 2. The table and bar graph below show the amount of rainfall in Laramie, Wyoming throughout the year. Averages for each month are reported and have been calculated from 1867 to 1987. Jan Feb Mar Apr May Jun Jul Aug Sep Oct Nov Dec Year 10.9 10.8 18.5 29.6 36.5 30.0 42.2 30.7 23.3 21.0 13.1 11.2 278.8 0.4 0.4 0.7 1.2 1.4 1.2 1.7 1.2 0.9 0.8 0.5 0.4 11.0 Water height in mm mm inches 45 40 35 30 25 20 15 10 5 0 Jan Feb Mar Apr May Jun Jul Aug Sep Oct Nov Dec Year A. Rate the statements below from very strongly disagree (1) to very strongly agree (5) on how well they match your interpretation of the trend depicted in the graph and table. 1. 2. 3. 4. 5. 6. The change in rain amount between months in the table implies that increase in rain is linear. The amount of rain increases at first. The water amount trend is best represented by a quadratic function, not a linear or exponential function. One can identify an entry in the table, such as in June there is 30.0 mm of rain, but cannot use the table to explain trend Trends cannot be determined from this table. The amount of rain across months is not changing at a constant or linear rate. The function y = -x2 + 12x – 4 is a possible model for Very strongly disagree Very strongly disagree Very strongly disagree Very strongly disagree Very strongly disagree Very strongly disagree 1 2 3 4 5 1 2 3 4 5 1 2 3 4 5 1 2 3 4 5 1 2 3 4 5 1 2 3 4 5 Very strongly agree Very strongly agree Very strongly agree Very strongly agree Very strongly agree Very strongly agree 7. this data, indicating that for a given year the average rain fall peaks in June at around 32 inches. Very strongly disagree 1 2 3 4 5 Very strongly agree 8. Trends can be determined from this graph. Very strongly disagree 1 2 3 4 5 Very strongly agree Water Cycle QR – Quantitative Interpretation Spring 2013 DATE 5-5-13 50 50 40 40 Frequency 30 20 30 20 10 10 0 0 0 5 10 Jan Feb Mar Apr May Jun Jul Aug Sep Oct Nov Dec Water Height in mm B. Below are eight different possible representations of the data table on the rainfall for Laramie, Wyoming. Use these representations and the table and bar graph above to answer questions B, C, and D. 15 Month Month 1. Scatter Plot Sep 8% Feb Mar 4% 7% Apr 11% Aug 11% May 13% Jul 15% Jun 11% 50 40 30 20 10 0 Jan Feb Mar Apr May Jun Jul Aug Sep Oct Nov Dec Jan 4% Water Height in mm Oct 7% Nov Dec 5% 4% 2. Histogram Month 3. Pie Chart 5. Linear equation representing data: y = .02x + 23 where January is numbered as month 0, x is month, y is water height 7. Exponential equation representing data: y = 20 x 2.5x where January is numbered as month 0, x is month, y is water height 4. Line Plot 6. Quadratic equation representing data: y = -0.9x2 + 11.5x - 3.6 where January is numbered as month 0, x is month, y is water height 8. Power equation representing data: y = 15 x0.2 where January is numbered as month 0, x is month, y is water height Water Cycle QR – Quantitative Interpretation Spring 2013 DATE 5-5-13 B. Rate the statements below from very strongly disagree (1) to very strongly agree (5) on how well they match your understanding of the representations. 1. 2. 3. 4. 5. 6. 7. 8. The power model gives amount of rain fall for June of 21.46, this does not match the table value of 30 so likely they collected rain amounts in different areas. One can compare the table with the scatter plot since both represent month and water height. The quadratic model gives a water height of 14 for November. While this varies from the table value for rain amount it does not mean one should not use this model. The other representations are of rain fall in different states. The quadratic model is a better fit then the linear model since the data trend is not linear. One would select the representation they prefer and use only it, since there may be differences in the values between the models. There can only be one representation of the amount of rainfall throughout the year, so the other representations are all wrong. One cannot compare the different representations of the data. Very strongly disagree 1 2 3 4 5 Very strongly agree Very strongly disagree 1 2 3 4 5 Very strongly agree Very strongly disagree 1 2 3 4 5 Very strongly agree 1 2 3 4 5 1 2 3 4 5 Very strongly disagree 1 2 3 4 5 Very strongly agree Very strongly disagree 1 2 3 4 5 Very strongly agree Very strongly disagree 1 2 3 4 5 Very strongly agree Very strongly disagree Very strongly disagree Very strongly agree Very strongly agree C. Rate the statements below from very strongly disagree (1) to very strongly agree (5) on how well they match your understanding of predicting future events. 1. 2. 3. 4. 5. 6. 7. 8. It has been raining more in recent years so the water height will increase next year. Determine an estimate of the rainfall water height given a specific month for next year by locating the given month in the graph for this year and determining the average water height during that month. The table represents average rainfall water height for each month over several years, so the amount may not be exactly the same next year. As one moves through the fall months into winter rainfall decreases, so next year there will likely be less rain in January then in December. To estimate the rainfall for next March, substitute 2 for March in the linear equation modeling the data, then solve for the water height. The rainfall in June of next year will be greater than the rainfall for June in the table. Since the graph only provides information for one year of rain, one cannot make predictions of future rain amounts beyond the given data. I am not sure how one can make predictions for future events from any of the representations. Very strongly disagree 1 2 3 4 5 Very strongly agree Very strongly disagree 1 2 3 4 5 Very strongly agree Very strongly disagree 1 2 3 4 5 Very strongly agree Very strongly disagree 1 2 3 4 5 Very strongly agree Very strongly disagree 1 2 3 4 5 Very strongly agree Very strongly disagree 1 2 3 4 5 Very strongly agree Very strongly disagree 1 2 3 4 5 Very strongly agree Very strongly disagree 1 2 3 4 5 Very strongly agree Water Cycle QR – Quantitative Interpretation Spring 2013 DATE 5-5-13 D. Rate the statements below from very strongly disagree (1) to very strongly agree (5) on how well they match your understanding of how we can revise models. To revise a model means to change a model to better reflect the real world data. 1. 2. 3. 4. 5. 6. 7. 8. A model for amount of rainfall is fixed and cannot be revised given new information. If the quadratic function does not fit the data, then there is error in the data we collected. One should evaluate the graph and the equation model of the data in the table to see how they inform each other. One should consider revising the model by relating the previous year rainfall trend in Wyoming to the year they are predicting. If the quadratic function does not fit the data, then we need to recollect the data to satisfy the known rainfall law. One should revise the model to better fit the evidence in the table not to make it fit a scientist’s expected model. We can test the graph or equation model for the water height to see if it is a good or bad fit. That is all the revision we can do. One should revise the model so that it improves the ability to predict events, perhaps the rainfall does not obey previous yearly trends. Very strongly disagree Very strongly disagree Very strongly agree Very strongly agree 1 2 3 4 5 1 2 3 4 5 Very strongly disagree 1 2 3 4 5 Very strongly agree Very strongly disagree 1 2 3 4 5 Very strongly agree Very strongly disagree 1 2 3 4 5 Very strongly agree Very strongly disagree 1 2 3 4 5 Very strongly agree Very strongly disagree 1 2 3 4 5 Very strongly agree Very strongly disagree 1 2 3 4 5 Very strongly agree Water Cycle QR – Quantitative Interpretation Spring 2013 DATE 5-5-13 3. Below is a chart and table of student collected data using an infiltrometer (instrument for measuring how fast water drains through a surface such as sand or grass). Time is in seconds and the height of water that has infiltrated is in milliliters. Time 0 0:30 1:00 1:30 2:00 2:30 Sand 0 320 Unknown Unknown Unknown Unknown Grass 0 60 110 140 165 190 Concrete 0 3 5 10 15 18 Roof Shingle 0 1 2 2 2 2 A. Rate the statements below from very strongly disagree (1) to very strongly agree (5) on how well they match your interpretation of the trend depicted in the graph and table. 1. Infiltration is decreasing over time. 2. Trends can be determined from a table. 3. Trends cannot be determined from a graph. 4. 5. 6. 7. 8. One can identify a point on the graph, such as (1:00, 110) as representing seconds and infiltration level for grass, but cannot use the graph to explain trend. The function y = 102.57 x .71 is a possible model for the grass data, indicating that the infiltration rate slows down over time. The rate of infiltration for grass is best represented by a power function, not a linear or quadratic function. The rate of infiltration for grass between 1:00 to 2:30 is less than the rate of infiltration between time 0 to 1:00. Infiltration rate of grass from time 0 to 2:30 is nonlinear. Very strongly disagree Very strongly disagree Very strongly disagree Very strongly agree Very strongly agree Very strongly agree 1 2 3 4 5 1 2 3 4 5 1 2 3 4 5 Very strongly disagree 1 2 3 4 5 Very strongly agree Very strongly disagree 1 2 3 4 5 Very strongly agree Very strongly disagree 1 2 3 4 5 Very strongly agree Very strongly disagree 1 2 3 4 5 Very strongly agree Very strongly disagree 1 2 3 4 5 Very strongly agree Water Cycle QR – Quantitative Interpretation Spring 2013 DATE 5-5-13 Below are different possible representations of the data table on infiltration. Use these representations and the table and graph above to answer questions B, C, and D. Grass Infiltration for 30 second intervals 0:30 1:00 1:30 2:00 2:30 0% 9% 29% 16% 25% Grass Concrete Roof Shingle 350 Water Depth (ml) 0 Sand 300 250 200 150 100 50 0 21% 0 0:30 1:00 1:30 2:00 2:30 Time (min:sec) Sand Grass Concrete Roof Shingle 2. Bar Graph 1000 800 400 Water Depth (ml) Water Depth (ml) 1. Pie Chart 300 200 100 0 0 0:30 1:00 1:30 2:00 2:30 Time (min:sec) 3. Connected Scatter Plot 5. Linear equation representing grass: y = 74x -19 where x=0 is time 0 and y is height in ml. 7. Exponential equation representing grass: y = 54.85 (1.72x) where x=0 is time 0 and y is height in ml. 600 400 200 0 0 -200 0:30 1:00 1:30 2:00 2:30 Time (min:sec) 4. Best Fit Curve 6. Quadratic equation representing grass: y = -5x2 + 715x – 64.5 where x=0 is time 0 and y is height in ml. 8. Power equation representing grass: y = 102.57 x .71 where x=0 is time 0 and y is height in ml. Water Cycle QR – Quantitative Interpretation Spring 2013 DATE 5-5-13 B. Rate the statements below from very strongly disagree (1) to very strongly agree (5) on how well they match your understanding of the representations. 1. 2. 3. 4. 5. 6. 7. 8. There can only be one representation of the infiltration, so the other representations are all wrong. One cannot compare the different representations of the data. One would select the representation they prefer and use only it, because there may be differences in the values between the models. The power model is a better fit than the linear model because of the rate of increase of infiltration decreasing over time. The other representations are of infiltration rate taken at a different site. One should not compare the pie chart to the graph since the pie chart provides percentage values and not water depth. The linear model for grass gives a water depth of 55 at time 1:00 minute. This varies from the table value for 1:00. One can compare the table with the connected scatter plot because both represent time and water depth. Very strongly disagree Very strongly disagree Very strongly agree Very strongly agree 1 2 3 4 5 1 2 3 4 5 Very strongly disagree 1 2 3 4 5 Very strongly agree Very strongly disagree 1 2 3 4 5 Very strongly agree Very strongly disagree 1 2 3 4 5 Very strongly agree Very strongly disagree 1 2 3 4 5 Very strongly agree Very strongly disagree 1 2 3 4 5 Very strongly agree Very strongly disagree 1 2 3 4 5 Very strongly agree C. Rate the statements below from very strongly disagree (1) to very strongly agree (5) on how well they match your understanding of predicting future events. 1. 2. 3. 4. 5. 6. 7. 8. Since the graph only provides water level from time 0 to 2 minutes 30 seconds; one cannot make predictions of infiltration beyond the given data. As time passes more rain falls so there will be more infiltration for the grassy surface. At a time of 3 minutes the water level for concrete will remain constant. To predict the infiltration amount at 3:30 minutes, substitute 3.5 into the equation model and solve for infiltration amount. The amount of water infiltrated is 20 ml per 30 seconds, so at 3 minutes, 210 ml of water would have been infiltrated. I am not sure how one can make predictions for future events from any of the representations. As time passes the infiltration rate is decreasing for the grassy surface. The concrete surface will stop infiltration at time 1:15. Very strongly disagree Very strongly agree 1 2 3 4 5 1 2 3 4 5 1 2 3 4 5 Very strongly disagree 1 2 3 4 5 Very strongly agree Very strongly disagree 1 2 3 4 5 Very strongly agree 1 2 3 4 5 1 2 3 4 5 1 2 3 4 5 Very strongly disagree Very strongly disagree Very strongly disagree Very strongly disagree Very strongly disagree Very strongly agree Very strongly agree Very strongly agree Very strongly agree Very strongly agree Water Cycle QR – Quantitative Interpretation Spring 2013 DATE 5-5-13 D. Rate the statements below from very strongly disagree (1) to very strongly agree (5) on how well they match your understanding of how we can revise models. To revise a model means to change a model to better reflect the real world data. 1. 2. 3. 4. 5. 6. 7. 8. One should revise the model so that it improves the ability to predict events, not revise the data to fit a model. A model for infiltration is fixed and cannot be revised given new information. One should revise the model to better fit the evidence in the table not to make it fit a scientist’s expectations. If a modeling function does not exactly fit the data, then the data was not collected correctly. One should evaluate the graph and the equation model of the data in the table to see how they inform each other. One can test the graph or equation model for the infiltration data to see if it is a good or bad fit. That is all the revision one can do. If a scientist says that infiltration rate should not be impacted by time, then one needs to recollect the data to satisfy the infiltration law. One should consider revising the model by relating the theory of infiltration to other surfaces. Very strongly disagree Very strongly disagree Very strongly disagree Very strongly disagree Very strongly disagree Very strongly agree Very strongly agree Very strongly agree Very strongly agree Very strongly agree 1 2 3 4 5 1 2 3 4 5 1 2 3 4 5 1 2 3 4 5 1 2 3 4 5 Very strongly disagree 1 2 3 4 5 Very strongly agree Very strongly disagree 1 2 3 4 5 Very strongly agree Very strongly disagree 1 2 3 4 5 Very strongly agree Water Cycle QR – Quantitative Interpretation Spring 2013 DATE 5-5-13 4. Below is a model of the global water cycle illustrating how water circulates on a global scale and a graph of change in sea level. A. Rate the statements below from very strongly disagree (1) to very strongly agree (5) on how well they match your interpretation of the trend depicted in the model and table. 2. The total flux can be found through addition, but one cannot determine the rate of flux. Trends cannot be determined from this box model. 3. Trends cannot be determined from a graph. 1. 4. 5. 6. 7. 8. The precipitation and evapotranspiration for grassland can be used to determine amount of flux for grassland, but the box model cannot be used to explain trends in overall flux. The function y = 0.0615x - 115.6 is a possible model for this data indicating that the change in sea level is increasing by a factor of .0615 each year. The sea level change is best represented by a power function not a linear or quadratic function. As years pass the sea level fluctuates, but overall is increasing. The sea level is increasing and the rate is not constant or linear. Very strongly disagree Very strongly disagree Very strongly disagree Very strongly agree Very strongly agree Very strongly agree 1 2 3 4 5 1 2 3 4 5 1 2 3 4 5 Very strongly disagree 1 2 3 4 5 Very strongly agree Very strongly disagree 1 2 3 4 5 Very strongly agree 1 2 3 4 5 1 2 3 4 5 1 2 3 4 5 Very strongly disagree Very strongly disagree Very strongly disagree Very strongly agree Very strongly agree Very strongly agree Water Cycle QR – Quantitative Interpretation Spring 2013 DATE 5-5-13 Below are different possible representations of the graph of sea level change. Use these representations and the box model and graph above to answer questions B, C, and D. 2% 1890 6% 28% 7% 15% 1910 1930 1950 24% 10 1870 18% Sea level Change 0% 8 6 4 2 0 1970 1990 2010 2. Bar Graph 10 Sea Level Change Sea Level Change 1. Pie Chart Year 8 6 4 2 0 Year 3. Connected Scatter Plot 5. Linear equation representing data y = 0.0615x - 115.6 with x = 0 representing year 1870 and y sea level change 7. Exponential equation representing data y = 0.6051 1.51x with x = 0 representing year 1870 and y sea level change 12 10 8 6 4 2 0 1850 1900 1950 2000 2050 Year 4. Best fit curve 6. Quadratic equation representing data y = 0.0002x2 - 0.6833x + 606.47 with x = 0 representing year 1870 and y sea level change 8. Power equation representing data y = 0.611x1.3456 with x = 0 representing year 1870 and y sea level change Water Cycle QR – Quantitative Interpretation Spring 2013 DATE 5-5-13 B. Rate the statements below from very strongly disagree (1) to very strongly agree (5) on how well they match your understanding of the representations. 1. 2. 3. 4. 5. 6. 7. 8. There can only be one representation of the sea level change, so the other representations are all wrong. One cannot compare the different representations of the data. One would select the representation they prefer and use only it, because there may be differences in the values between the models. A linear model is a close fit to the data, indicating a constant rate of increase of the sea level. The other representations are of sea level change in other areas of the world. One should not compare the best fit curve to the box model since the best fit curve is representing sea level change and the box model is representing the water cycle movement. The line graph represents the sea level change during a period of time, between 1870 and 2010 while the box model representing water flow movement is an average over a period of time. So the two models cannot be compared. One can compare the bar graph with the line graph because both represent sea level change over time. Very strongly disagree Very strongly disagree Very strongly agree Very strongly agree 1 2 3 4 5 1 2 3 4 5 1 2 3 4 5 1 2 3 4 5 1 2 3 4 5 Very strongly disagree 1 2 3 4 5 Very strongly agree Very strongly disagree 1 2 3 4 5 Very strongly agree Very strongly disagree 1 2 3 4 5 Very strongly agree Very strongly disagree Very strongly disagree Very strongly disagree Very strongly agree Very strongly agree Very strongly agree C. Rate the statements below from very strongly disagree (1) to very strongly agree (5) on how well they match your understanding of predicting future events. 1. 2. 3. 4. 5. 6. 7. 8. One cannot predict future events from a box model. According to the box model, water is flowing at the same rate throughout the system. According to the box model, flux varies between different surface areas. To predict the sea level change in 2030, use one of the equation models and plug in 160 for x. As time passes sea level change increases which indicates more water is being stored in the sea over the years. I am not sure how one can make predictions for future events from any of the representations. As time goes beyond 2010 the sea level will continue to increase. The landmass areas with larger surface areas have a higher total flux compared to those that have a smaller area. Very strongly disagree Very strongly disagree Very strongly disagree Very strongly disagree Very strongly disagree Very strongly disagree Very strongly disagree Very strongly disagree 1 2 3 4 5 1 2 3 4 5 1 2 3 4 5 1 2 3 4 5 1 2 3 4 5 1 2 3 4 5 1 2 3 4 5 1 2 3 4 5 Very strongly agree Very strongly agree Very strongly agree Very strongly agree Very strongly agree Very strongly agree Very strongly agree Very strongly agree Water Cycle QR – Quantitative Interpretation Spring 2013 DATE 5-5-13 D. Rate the statements below from very strongly disagree (1) to very strongly agree (5) on how well they match your understanding of how we can revise models. To revise a model means to change a model to better reflect the real world data. 1. 2. 3. 4. 5. 6. 7. 8. One should revise the box model to make it fit a scientist’s expectations. One should evaluate the box model and the equation model of the data in the table to see how they inform each other. One can test the box model for flux of a particular surface area data to see if it is a good or bad fit. That is all the revision one can do. One should revise the box model so that it improves the ability to predict events, not revise the data to fit a model. If a scientist says sea levels change at a constant rate of 1 inch per 10 years then one needs to recollect the data. The box model is fixed and cannot be revised given new information. One should consider revising the model if sea rise only in the pacific ocean is considered. If the box model does not exactly fit the data, then there is error in the data we collected. Very strongly disagree 1 2 3 4 5 Very strongly agree Very strongly disagree 1 2 3 4 5 Very strongly agree Very strongly disagree 1 2 3 4 5 Very strongly agree Very strongly disagree 1 2 3 4 5 Very strongly agree 1 2 3 4 5 1 2 3 4 5 1 2 3 4 5 1 2 3 4 5 Very strongly disagree Very strongly disagree Very strongly disagree Very strongly disagree Very strongly agree Very strongly agree Very strongly agree Very strongly agree
