docx
advertisement

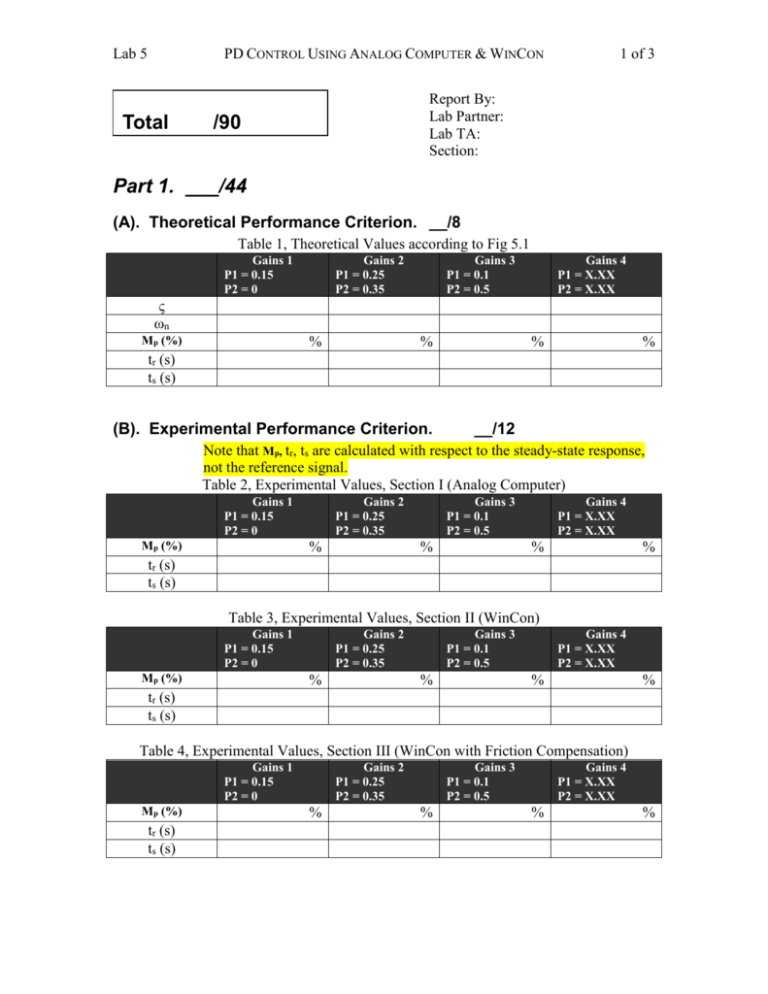
Lab 5 PD CONTROL USING ANALOG COMPUTER & WINCON 1 of 3 Report By: Lab Partner: Lab TA: Section: Total ___/90 Part 1. ___/44 (A). Theoretical Performance Criterion. __/8 Table 1, Theoretical Values according to Fig 5.1 Gains 1 P1 = 0.15 P2 = 0 Gains 2 P1 = 0.25 P2 = 0.35 Gains 3 P1 = 0.1 P2 = 0.5 Gains 4 P1 = X.XX P2 = X.XX ς ωn Mp (%) % % % % tr (s) ts (s) (B). Experimental Performance Criterion. __/12 Note that Mp, tr, ts are calculated with respect to the steady-state response, not the reference signal. Table 2, Experimental Values, Section I (Analog Computer) Gains 1 P1 = 0.15 P2 = 0 Mp (%) Gains 2 P1 = 0.25 P2 = 0.35 % Gains 3 P1 = 0.1 P2 = 0.5 % Gains 4 P1 = X.XX P2 = X.XX % % tr (s) ts (s) Table 3, Experimental Values, Section II (WinCon) Gains 1 P1 = 0.15 P2 = 0 Mp (%) Gains 2 P1 = 0.25 P2 = 0.35 % Gains 3 P1 = 0.1 P2 = 0.5 % Gains 4 P1 = X.XX P2 = X.XX % % tr (s) ts (s) Table 4, Experimental Values, Section III (WinCon with Friction Compensation) Gains 1 P1 = 0.15 P2 = 0 Mp (%) tr (s) ts (s) Gains 2 P1 = 0.25 P2 = 0.35 % Gains 3 P1 = 0.1 P2 = 0.5 % Gains 4 P1 = X.XX P2 = X.XX % % Lab 5 PD CONTROL USING ANALOG COMPUTER & WINCON 2 of 3 Compare results from Section I with those from Section II ___/8 Note any differences and characteristic similarities. Should they be the same? If they are different, why do they differ? Compare results from Section II with those from Section III ___/16 Note any differences and characteristic similarities. Should they be the same? If they are different, why do they differ? Also, what are the effects of friction on the response of the system (How does it affect Mp, tr, and ts)? Part 2. ___/18 Compare performance of your design to the Specs ___/10 Did you meet the specifications given in the prelab (<15% overshoot, < 30 ms rise time)? If not, suggest improvements to do so. (i.e. What gains were close – what values would be better?) Explain how unmodeled plant dynamics might cause problems ___/8 Give an example of dynamics that were un-modeled (or ignored) on the prelab. What problems could these dynamics cause? Part 3. ___/16 Theoretical and measured Ess ___/8 Gains 1 P1 = 0.15 P2 = 0 Theoretical Section I Section II Section III Gains 2 P1 = 0.25 P2 = 0.35 Gains 3 P1 = 0.1 P2 = 0.5 % % % % % % % % Table 5, Steady-state error Gains 4 P1 = X.XX P2 = X.XX % % % % What gain adjustments helped decrease steady-state error? Give a general rule for which gain values give the lowest steady state error. % % % % ___/8 Lab 5 PD CONTROL USING ANALOG COMPUTER & WINCON 3 of 3 Part 4. ___/12 Friction Values Friction Values ___/6 Lab 4 Lab5, Section III full values Lab5, Section III Reduced values Coulomb Positive Coulomb Negative Viscous Positive Viscous Negative Table 6, Friction Values Discuss the Variation in the friction Values ___/6 How much did you have to reduce the friction values? How do both results from lab 5 compare with lab 4?


